Ch.17 - Applications of Aqueous Equilibria
McMurry - Chemistry 8th Edition
McMurry8th EditionChemistryISBN: 9781292336145당신이 사용하는 게 아니라요?교과서 변경
17장, 문제 87

On the same graph, sketch pH titration curves for the titra-tion of (1) a strong acid with a strong base and (2) a weak acid with a strong base. How do the two curves differ with respect to the following? (a) The initial pH

검증된 단계별 안내
1
insert step 1> Identify the acids and bases involved in each titration. For the strong acid-strong base titration, consider an example like HCl (strong acid) and NaOH (strong base). For the weak acid-strong base titration, consider an example like CH3COOH (acetic acid, weak acid) and NaOH (strong base).
insert step 2> Understand the initial pH of each solution before any base is added. For the strong acid, the initial pH is low because strong acids dissociate completely in water, resulting in a high concentration of H+ ions. For the weak acid, the initial pH is higher than that of the strong acid because weak acids only partially dissociate in water.
insert step 3> Sketch the pH titration curve for the strong acid with a strong base. Start with a low pH, and as the base is added, the pH will increase rapidly near the equivalence point, which is typically around pH 7 for strong acid-strong base titrations.
insert step 4> Sketch the pH titration curve for the weak acid with a strong base. Start with a higher initial pH compared to the strong acid. The curve will have a more gradual slope and the equivalence point will be above pH 7 due to the formation of a weak conjugate base.
insert step 5> Compare the initial pH of both titration curves. The strong acid-strong base titration starts at a lower pH compared to the weak acid-strong base titration, reflecting the complete dissociation of the strong acid versus the partial dissociation of the weak acid.

비슷한 문제에 대한 검증된 영상 답변:

이 영상 해법은 위 문제에 도움이 된다고 튜터들이 추천한 것입니다.
영상 길이:
7m

주요 개념

질문에 올바르게 답하기 위해 반드시 이해해야 하는 핵심 개념들은 다음과 같습니다.

Strong Acid vs. Weak Acid

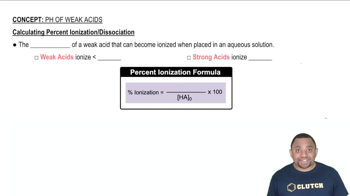
A strong acid completely dissociates in solution, resulting in a high concentration of hydrogen ions (H+) and a low initial pH. In contrast, a weak acid only partially dissociates, leading to a higher initial pH due to the lower concentration of H+ ions. This fundamental difference affects the shape of the titration curve.
추천 영상:
가이드 코스
01:15
Calculating Percent Ionization of Weak Acids

Titration Curves

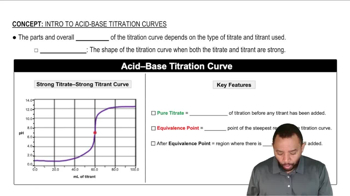
Titration curves graph the pH of a solution as a function of the volume of titrant added. For a strong acid-strong base titration, the curve shows a sharp increase in pH at the equivalence point, while a weak acid-strong base titration displays a more gradual slope and a buffer region before the equivalence point, reflecting the weak acid's resistance to pH changes.
추천 영상:
가이드 코스
02:16
Acid-Base Titration Curves

Equivalence Point

The equivalence point in a titration is reached when the amount of titrant added is stoichiometrically equivalent to the amount of substance in the solution. For strong acid-strong base titrations, this point typically occurs at pH 7, while for weak acid-strong base titrations, it occurs at a pH greater than 7 due to the formation of a weak conjugate base.
추천 영상:
가이드 코스
01:07
At the Equivalence Point