Ch.2 - Atoms & Elements
Tro - Chemistry: A Molecular Approach 5th Edition
Tro5th EditionChemistry: A Molecular ApproachISBN: 9780134874371당신이 사용하는 게 아니라요?교과서 변경
2장, 문제 71

How would you sketch the mass spectrum of gallium given its two naturally occurring isotopes with the following masses and natural abundances: Isotope Mass (amu) Abundance (%) Ga-69 68.92558 60.108 Ga-71 70.92470 39.892?

검증된 단계별 안내
1
Determine the relative abundance of each isotope by converting the percentage to a decimal. For Ga-69, it is 0.60108 and for Ga-71, it is 0.39892.
Consider the x-axis of the mass spectrum, which represents the mass-to-charge ratio (m/z). Since the charge is typically +1 for singly charged ions, the m/z values will be approximately equal to the isotopic masses: 68.92558 for Ga-69 and 70.92470 for Ga-71.
The y-axis of the mass spectrum represents the relative intensity, which is proportional to the abundance of each isotope.
Plot the first peak at m/z = 68.92558 with a relative intensity corresponding to the abundance of Ga-69 (60.108%).
Plot the second peak at m/z = 70.92470 with a relative intensity corresponding to the abundance of Ga-71 (39.892%).

주요 개념

질문에 올바르게 답하기 위해 반드시 이해해야 하는 핵심 개념들은 다음과 같습니다.

Isotopes

Isotopes are variants of a chemical element that have the same number of protons but different numbers of neutrons, resulting in different atomic masses. For gallium, the two isotopes, Ga-69 and Ga-71, have distinct masses and natural abundances, which are crucial for understanding how they contribute to the overall mass spectrum.
추천 영상:

Mass Spectrum

A mass spectrum is a graphical representation of the mass-to-charge ratio of ions. It displays the relative abundance of each isotope, allowing for the identification of isotopes present in a sample. The x-axis typically represents the mass-to-charge ratio (m/z), while the y-axis shows the intensity or abundance of each ion detected.
추천 영상:
가이드 코스
02:53
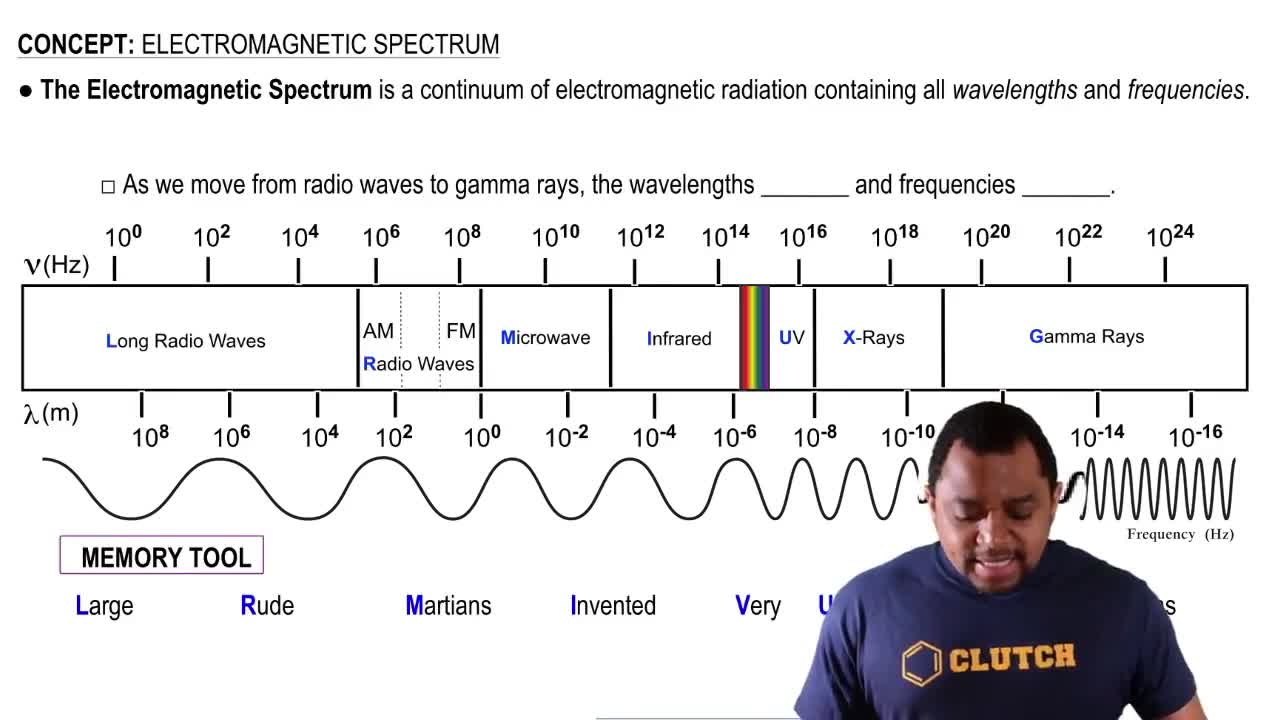
Electromagnetic Spectrum

Relative Abundance

Relative abundance refers to the percentage of each isotope present in a naturally occurring sample of an element. In the case of gallium, the relative abundances of Ga-69 and Ga-71 are 60.108% and 39.892%, respectively. This information is essential for calculating the weighted average mass of gallium and accurately sketching its mass spectrum.
추천 영상:
가이드 코스
5:42
Calculating Abundance Example