 뒤로
뒤로Gene Linkage, Recombination, and Genetic Mapping: Study Notes for Genetics Students
스터디 가이드 - 스마트 노트
 자료에 맞춘 맞춤형 노트, 핵심 정의, 예시, 맥락을 확장해 제공합니다.
Gene Linkage, Recombination, and Mapping
Introduction to Genetic Mapping
Genetic mapping is a foundational tool in genetics, used to determine the relative positions of genes on chromosomes. Unlike direct sequencing, mapping relies on the observation of recombination events and the inheritance of genetic markers to locate genes associated with traits or diseases.
Genetic markers such as SNPs (single nucleotide polymorphisms) are used to track inheritance patterns.
Mapping is especially important in humans, where controlled crosses are not possible.
Genetic Markers and Haplotypes
Types of Genetic Markers
Genetic markers are DNA sequence variants used to study gene locations. Common types include:
Variable Number Tandem Repeats (VNTRs)
Single Nucleotide Polymorphisms (SNPs): Single base pair changes, abundant in the genome, and useful for mapping.
Restriction Fragment Length Polymorphisms (RFLPs)
Haplotypes
A haplotype is a specific combination of alleles or SNPs in a small chromosomal region. Closely linked SNPs tend to be inherited together, forming a haplotype. Tracking haplotypes allows researchers to associate genetic markers with disease alleles.
Haplotypes can differ between homologous chromosomes in an individual.
They are used to trace inheritance and identify linkage to disease-causing genes.
Gene Linkage and Recombination
Concept of Linkage
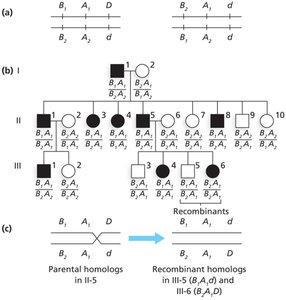
Genes located close together on the same chromosome are called linked genes. They tend to be inherited together because crossing over between them is infrequent.
Syntenic genes: Genes on the same chromosome.
Linked genes: Syntenic genes close enough that their alleles do not assort independently.
Crossing Over and Recombination
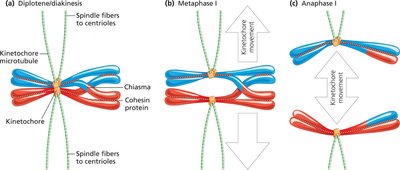
During meiosis, homologous chromosomes can exchange segments in a process called crossing over, resulting in recombinant chromosomes. The frequency of recombination reflects the physical distance between genes.
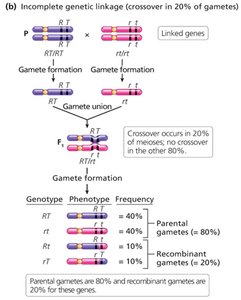
Parental (nonrecombinant) chromosomes retain the original allele combinations.
Recombinant chromosomes have new combinations due to crossing over.
Recombination Frequency and Genetic Distance
The recombination frequency (r) is calculated as:
1% recombination = 1 map unit = 1 centiMorgan (cM).
Genes with r >= 50% are considered unlinked.
Detecting Linkage in Humans
Pedigree Analysis and LOD Scores
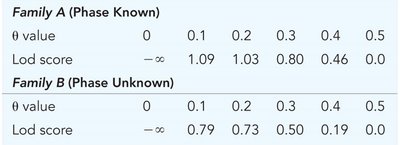
Linkage in humans is detected using pedigrees and statistical methods such as the logarithm of odds (LOD) score analysis. The LOD score compares the likelihood of observed data under linkage versus independent assortment.
LOD score > 3.0: Significant evidence for linkage.
LOD score < -2.0: Significant evidence against linkage.
LOD score between -2.0 and 3.0: Inconclusive.
Example: Huntington Disease Mapping
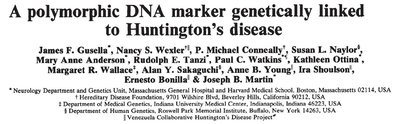
Haplotypes were used to track the inheritance of Huntington Disease, leading to the identification of the HTT gene. SNPs near the disease allele were used as markers, even though they were not the causative mutation.
Genome-Wide Association Studies (GWAS)
Principles of GWAS
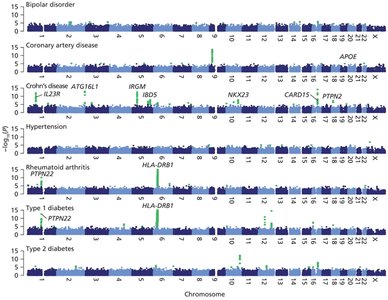
GWAS compares SNP frequencies between cases (individuals with a trait) and controls (without the trait) to identify genetic associations with complex diseases.
Results are visualized in Manhattan plots, where peaks indicate strong associations.
GWAS can implicate regions containing multiple genes, requiring further analysis to pinpoint causative genes.
Linkage Disequilibrium (LD)
Definition and Calculation
Linkage disequilibrium (LD) refers to the non-random association of alleles at different loci. It is quantified by the coefficient D:
D = 0: Loci are in equilibrium (independent assortment).
D > 0: Excess coupling (alleles found together more often than expected).
D < 0: Excess repulsion (alleles found together less often than expected).
Causes of Linkage Disequilibrium
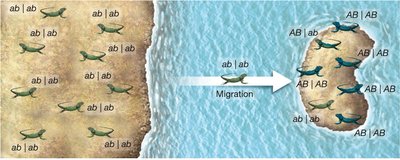
Migration: Introduction of new haplotypes into a population.
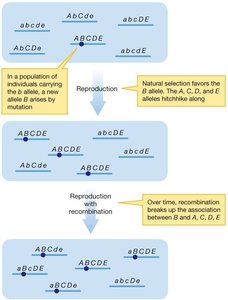
Genetic hitchhiking: Selection for a beneficial allele increases the frequency of linked alleles.
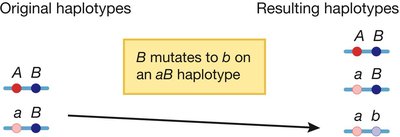
New mutations: Initially create LD with nearby alleles.
Decay of Linkage Disequilibrium
Recombination breaks down LD over generations. The change in D per generation is given by:
where r is the recombination rate. Over time, D approaches zero unless maintained by selection or other forces.
Gene Mapping with Test Crosses and Three-Point Crosses
Test Crosses and Parental vs. Recombinant Gametes
Test crosses are used to determine the arrangement of alleles and calculate recombination frequencies. Parental gametes retain the original allele combinations, while recombinant gametes result from crossing over.
Three-Point Crosses
Three-point crosses allow for the determination of gene order and calculation of map distances between three linked genes. The least abundant progeny class identifies the double crossover, revealing the gene in the middle.
Calculate recombination frequencies between each pair of genes to construct a genetic map.
1% recombination = 1 cM.
Physical vs. Genetic Maps
Hotspots and Coldspots of Recombination
Genetic distance (measured in cM) does not always correspond to physical distance (measured in base pairs) due to recombination hotspots (regions with high crossover rates) and coldspots (regions with low crossover rates).
Hotspots stretch the genetic map relative to the physical map.
Coldspots compress the genetic map.
Summary Table: Key Concepts in Gene Linkage and Mapping
Concept | Definition | Key Formula |
|---|---|---|
Genetic Marker | DNA sequence variant used for mapping | — |
Haplotype | Combination of alleles/SNPs inherited together | — |
Recombination Frequency (r) | Proportion of recombinant progeny | |
LOD Score | Logarithm of odds for linkage | LOD > 3: Linked; LOD < -2: Not linked |
Linkage Disequilibrium (D) | Non-random association of alleles | |
Decay of D | Reduction of LD by recombination |
Conclusion
Gene linkage and mapping are essential for understanding the genetic basis of traits and diseases. By analyzing recombination frequencies, haplotypes, and linkage disequilibrium, geneticists can construct maps that guide the identification of causative genes and inform studies of evolution and population genetics.
