
Ch. 3 - Mendelian Genetics
Klug - Essentials of Genetics 10th Edition
Klug10th EditionEssentials of GeneticsISBN: 9780135588789당신이 사용하는 게 아니라요?교과서 변경
3장, 문제 16

In assessing data that fell into two phenotypic classes, a geneticist observed values of 250:150. She decided to perform a χ\(\chi\)² analysis by using the following two different null hypotheses:
(a) the data fit a 3:1 ratio, and
(b) the data fit a 1:1 ratio.
Calculate the χ\(\chi\) ² values for each hypothesis. What can be concluded about each hypothesis?

검증된 단계별 안내
1
Step 1: Identify the observed values and total number of observations. Here, the observed counts are 250 and 150, so the total is 250 + 150 = 400.
Step 2: For hypothesis (a), where the expected ratio is 3:1, calculate the expected counts by dividing the total according to this ratio. The expected count for the first class is \(\frac{3}{4} \times 400\), and for the second class is \(\frac{1}{4} \times 400\).
Step 3: For hypothesis (b), where the expected ratio is 1:1, calculate the expected counts by dividing the total equally. Each class is expected to have \(\frac{1}{2} \times 400\) individuals.
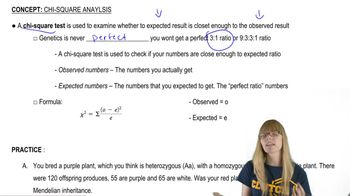
Step 4: Use the chi-square formula to calculate the chi-square value for each hypothesis: \(\chi^{2} = \sum \frac{(O - E)^2}{E}\) where \(O\) is the observed count and \(E\) is the expected count for each phenotypic class. Calculate this sum separately for each hypothesis using their respective expected counts.
Step 5: Compare the calculated chi-square values to the critical chi-square value from the chi-square distribution table at the appropriate degrees of freedom (df = number of classes - 1) and significance level (commonly 0.05). If the calculated value is less than the critical value, the hypothesis fits the data well; if greater, the hypothesis is rejected.

비슷한 문제에 대한 검증된 영상 답변:

이 영상 해법은 위 문제에 도움이 된다고 튜터들이 추천한 것입니다.
영상 길이:
1m
도움이 되었나요?

주요 개념

질문에 올바르게 답하기 위해 반드시 이해해야 하는 핵심 개념들은 다음과 같습니다.

Chi-Square (χ²) Test

The chi-square test is a statistical method used to compare observed data with expected data based on a specific hypothesis. It calculates a χ² value that measures the difference between observed and expected frequencies. A higher χ² value indicates a greater deviation from the expected ratio, helping to determine if the null hypothesis can be rejected.
추천 영상:
가이드 코스
02:48
Chi Square Analysis

Null Hypothesis in Genetic Ratios

In genetics, the null hypothesis often states that observed phenotypic ratios fit a predicted Mendelian ratio, such as 3:1 or 1:1. This hypothesis assumes no significant difference between observed and expected data. Testing different null hypotheses helps identify which genetic model best explains the observed data.
추천 영상:
가이드 코스
03:13
Translation:Wobble Hypothesis

Interpreting Chi-Square Results

After calculating the χ² value, it is compared to a critical value from the chi-square distribution table based on degrees of freedom and significance level. If χ² is less than the critical value, the null hypothesis is accepted; if greater, it is rejected. This interpretation determines whether observed deviations are due to chance or indicate a different genetic pattern.
추천 영상:
가이드 코스
02:48
Chi Square Analysis