Ch. 25 - Quantitative Genetics and Multifactorial Traits
Klug - Concepts of Genetics  12th Edition
Klug12th EditionConcepts of Genetics ISBN: 9780135564776당신이 사용하는 게 아니라요?교과서 변경
25장, 문제 11

Corn plants from a test plot are measured, and the distribution of heights at 10-cm intervals is recorded in the following table: 
 Height (cm)   Plants (no.)    
100          20    
110          60    
120          90    
130         130    
140         180   
 150         120    
160          70    
170         50    
180         40 
Calculate 
(a) the mean height, 
(b) the variance, 
(c) the standard deviation, and 
(d) the standard error of the mean. 
Plot a rough graph of plant height against frequency. Do the values represent a normal distribution? Based on your calculations, how would you assess the variation within this population?

검증된 단계별 안내
1
Step 1: Calculate the total number of plants by summing all the frequencies given for each height interval. This total will be used as the denominator for calculating the mean and other statistics.
Step 2: Calculate the mean height using the formula for the weighted average: \(\text{Mean} = \frac{\sum (x_i \times f_i)}{\sum f_i}\), where \(x_i\) is the height value and \(f_i\) is the number of plants at that height.
Step 3: Calculate the variance using the formula: \(\text{Variance} = \frac{\sum f_i (x_i - \text{Mean})^2}{\sum f_i}\). This involves subtracting the mean from each height, squaring the result, multiplying by the frequency, summing all these values, and dividing by the total number of plants.
Step 4: Calculate the standard deviation by taking the square root of the variance: \(\text{Standard Deviation} = \sqrt{\text{Variance}}\). This gives a measure of the spread of the heights around the mean.
Step 5: Calculate the standard error of the mean (SEM) using the formula: \(\text{SEM} = \frac{\text{Standard Deviation}}{\sqrt{n}}\), where \(n\) is the total number of plants. This quantifies the precision of the mean estimate.
Step 6: To plot the graph, place plant height on the x-axis and frequency (number of plants) on the y-axis. Connect the points to visualize the distribution shape. Assess whether the distribution resembles a normal distribution by checking if it is roughly symmetric and bell-shaped.
Step 7: Based on the calculated variance and standard deviation, discuss the degree of variation within the population. A smaller standard deviation indicates less variation, while a larger one indicates more spread in plant heights.

비슷한 문제에 대한 검증된 영상 답변:

이 영상 해법은 위 문제에 도움이 된다고 튜터들이 추천한 것입니다.
영상 길이:
1m
도움이 되었나요?

주요 개념

질문에 올바르게 답하기 위해 반드시 이해해야 하는 핵심 개념들은 다음과 같습니다.

Measures of Central Tendency (Mean)

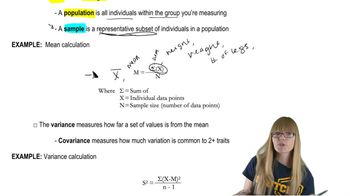
The mean is the average value of a data set, calculated by summing all observations multiplied by their frequencies and dividing by the total number of observations. It represents the central point of the data distribution and is essential for summarizing the typical plant height in the population.
추천 영상:
가이드 코스
11:06
Mathematical Measurements

Variance and Standard Deviation

Variance measures the average squared deviation of each data point from the mean, quantifying the spread of the data. The standard deviation is the square root of the variance, providing a measure of dispersion in the same units as the data. Both indicate how much individual plant heights vary around the mean.
추천 영상:
가이드 코스
08:34
Analyzing Trait Variance

Standard Error of the Mean and Normal Distribution

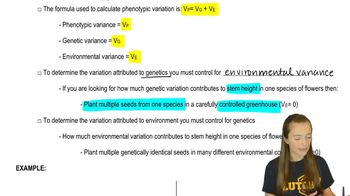
The standard error of the mean estimates the precision of the sample mean as an estimate of the population mean, calculated by dividing the standard deviation by the square root of the sample size. Assessing the shape of the frequency distribution (e.g., normal distribution) helps determine if the data variation is random and symmetrically distributed around the mean.
추천 영상:
가이드 코스
11:06
Mathematical Measurements