At 100 °C, which of the following diagrams (1, 2, or 3) represents a gas sample that exerts the: (8.1)
b. highest pressure??
검증된 단계별 안내
1
Understand that pressure is related to the number of gas particles and the volume they occupy.
Recall that at a constant temperature, pressure is directly proportional to the number of gas particles in a given volume (according to the ideal gas law, PV = nRT).
Examine each diagram to determine which one has the greatest number of gas particles in the same volume.
Identify the diagram with the highest density of gas particles, as this will exert the highest pressure.
Conclude that the diagram with the most particles in the smallest space represents the gas sample with the highest pressure.
비슷한 문제에 대한 검증된 영상 답변:
이 영상 해법은 위 문제에 도움이 된다고 튜터들이 추천한 것입니다.
영상 길이:
1m
영상 재생:
0 댓글
주요 개념
질문에 올바르게 답하기 위해 반드시 이해해야 하는 핵심 개념들은 다음과 같습니다.
Gas Pressure
Gas pressure is the force exerted by gas particles colliding with the walls of their container. It is influenced by the number of particles, their speed, and the volume of the container. Higher temperatures increase the kinetic energy of gas molecules, leading to more frequent and forceful collisions, which results in higher pressure.
The Kinetic Molecular Theory explains the behavior of gases in terms of particle motion. It posits that gas particles are in constant, random motion and that their kinetic energy is directly proportional to the temperature of the gas. This theory helps to understand how changes in temperature and volume affect gas pressure.
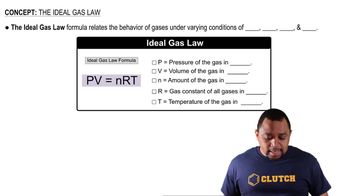
The Ideal Gas Law, represented as PV = nRT, relates pressure (P), volume (V), number of moles (n), the ideal gas constant (R), and temperature (T). This equation allows for the calculation of one variable when the others are known, providing a framework for understanding how gases behave under different conditions, including pressure at a given temperature.

 1:51분
1:51분 검증된 단계별 안내
 01:15
01:15