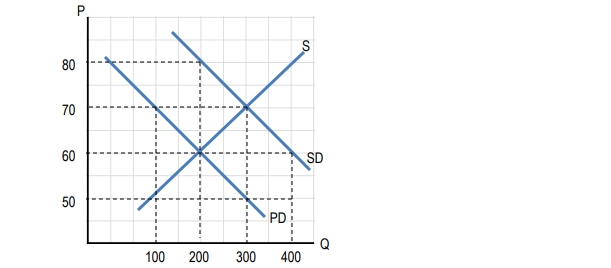
Use this diagram to answer the following questions. PD is private demand. SD is social demand. Based on the figure above, an unregulated market would produce:
A
100 units
B
200 units
C
300 units
D
400 units
0 댓글
검증된 단계별 안내
1
Identify the curves on the graph: The graph shows two demand curves, PD (Private Demand) and SD (Social Demand), and one supply curve, S.
Understand the concept: In an unregulated market, the equilibrium quantity is determined by the intersection of the private demand curve (PD) and the supply curve (S).
Locate the intersection of PD and S: Look at the graph to find the point where the PD curve intersects with the S curve. This point represents the equilibrium in an unregulated market.
Determine the quantity at this intersection: From the intersection point, draw a vertical line down to the quantity axis (Q) to find the equilibrium quantity.
Compare the equilibrium quantity with the options: Check which of the given options (100 units, 200 units, 300 units, 400 units) matches the quantity determined from the graph.


 검증된 단계별 안내

