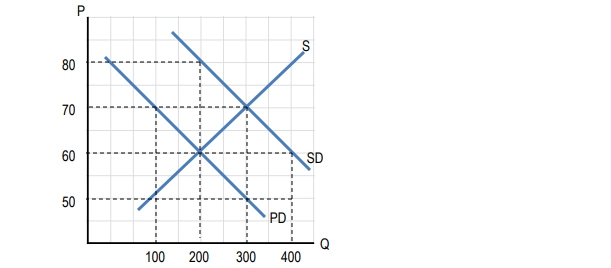
Use this diagram to answer the following questions. PD is private demand. SD is social demand. The figure above contains:
A
A positive externality
B
A negative externality
C
Both positive and negative externalities
D
No externalities
0 댓글
검증된 단계별 안내
1
Identify the curves on the graph: The graph shows two demand curves, PD (Private Demand) and SD (Social Demand), and one supply curve, S.
Understand the concept of externalities: A positive externality occurs when the social demand (SD) is greater than the private demand (PD), indicating that the social benefits exceed the private benefits. A negative externality would be the opposite, where social demand is less than private demand.
Analyze the graph: Observe that the SD curve is above the PD curve at any given quantity. This suggests that the social value of the good is higher than the private value, indicating a positive externality.
Consider the implications: The presence of a positive externality means that the market equilibrium quantity (where PD intersects S) is less than the socially optimal quantity (where SD intersects S).
Conclude based on the analysis: Since the SD curve is consistently above the PD curve, the diagram represents a situation with a positive externality.


 검증된 단계별 안내

