 뒤로
뒤로Long-Run Economic Growth: Concepts, Measurement, and Global Patterns
스터디 가이드 - 스마트 노트
 자료에 맞춘 맞춤형 노트, 핵심 정의, 예시, 맥락을 확장해 제공합니다.
An Overview of Long-Run Economic Growth
Introduction
Long-run economic growth is a central topic in macroeconomics, focusing on how economies expand their productive capacity and improve living standards over time. This chapter introduces key facts, measurement tools, and concepts related to economic growth, setting the stage for deeper analysis in subsequent chapters.
Economic growth has dramatically improved welfare globally, but is a relatively recent phenomenon.
Growth rates and standards of living differ significantly across countries and historical periods.
Tools for studying growth include calculation of growth rates and graphical analysis.
Growth Over the Very Long Run
Historical Patterns and the Great Divergence
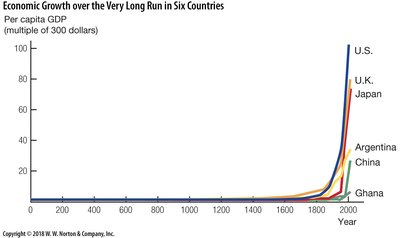
Sustained increases in standards of living are a modern development, with economic growth emerging at different times and places. The "Great Divergence" refers to the widening gap in per capita GDP between countries since the 18th century.
Before 1700, per capita GDP differences between nations were modest (factor of 2-3).
Today, per capita GDP can differ by a factor of 50 between countries.
The Great Divergence highlights the recent era of increased differences in living standards.
Modern Economic Growth
Trends in the United States and Implications
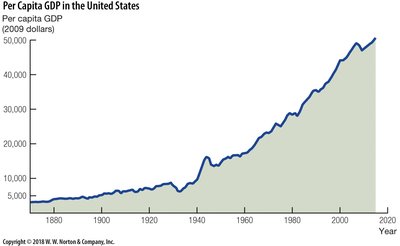
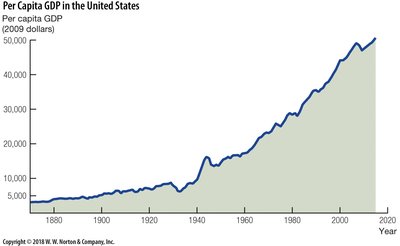
Modern economic growth is characterized by rapid increases in real per capita GDP, especially since the late 19th century. For example, from 1870 to 2000, U.S. real per capita GDP rose nearly fifteen-fold, profoundly affecting lifetime incomes and welfare.
College students today can expect lifetime incomes about twice that of their parents.
Growth rates compound over time, leading to large differences in output levels.
Modern Growth Around the World
Post-War Growth and Convergence
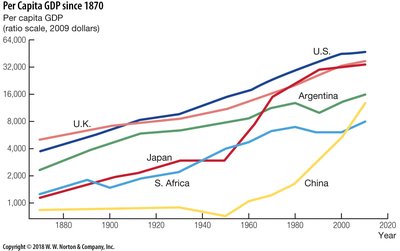
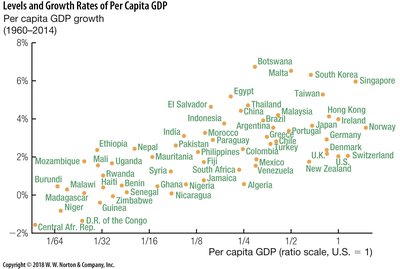
After World War II, countries like Germany and Japan experienced accelerated growth, while others, such as Brazil, saw stagnation after initial progress. China and India have recently exhibited rapid growth. The concept of convergence suggests that poorer countries may grow faster to catch up with richer nations.
Growth rates vary widely across countries and periods.
Some countries have negative growth rates, while others sustain high growth.
Small differences in growth rates can result in large differences in living standards over time.
Measuring Growth Rates
Definition and Calculation of Growth Rates
Growth rates measure the percentage change in a variable (such as GDP or population) between two periods. The constant growth rate rule provides a formula for calculating the value of a variable over time when it grows at a constant rate.
Growth rate is the percentage change between two periods, divided by the initial value.
For per capita GDP, the formula is:
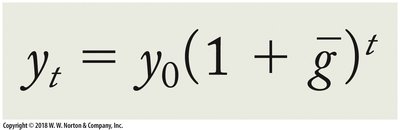
Where is the value at time , is the initial value, and is the constant growth rate.
Example: Impact of Small Differences in Growth Rates
Even small differences in annual growth rates can lead to substantial differences in output levels over long periods. For instance, two countries starting at the same GDP level but growing at 1% and 0.25% per year will diverge significantly over 100 years.
Population Growth and Ratio Scales
Standard vs. Ratio (Log) Scales
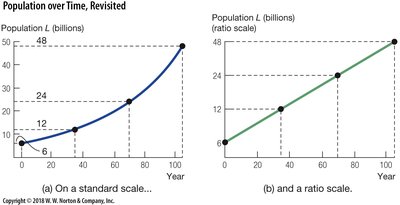
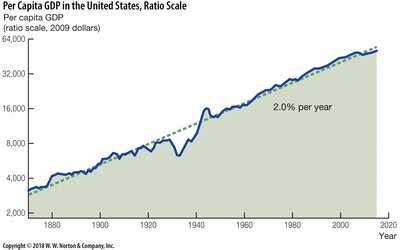
Population and GDP growth can be visualized using standard and ratio (log) scales. On a ratio scale, equal distances represent equal ratios, and constant growth rates appear as straight lines.
Ratio scales help identify exponential growth and make comparisons easier.
For U.S. GDP, a ratio scale shows approximately linear growth at 2% per year over 130 years.
Calculating Average Growth Rates
Formula for Average Growth Rate
The average growth rate over a period can be calculated using the following formula:
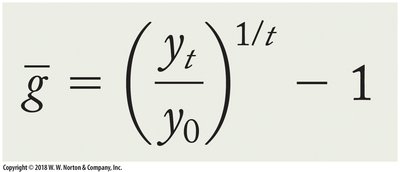
This formula allows for comparison of growth rates across different time spans.
Properties and Rules of Growth Rates
Rules for Combining Growth Rates
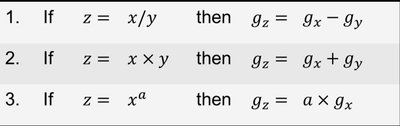
When variables are combined (added, multiplied, or raised to a power), their growth rates follow specific rules:
If , then
If , then
If , then
Examples of Growth Rate Calculations
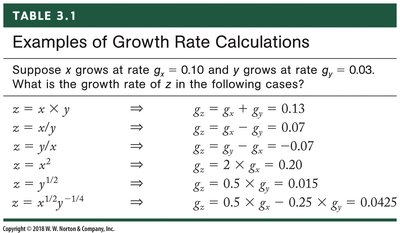
Table 3.1 provides practical examples of how to calculate growth rates for various combinations of variables:
Expression | Growth Rate |
|---|---|
z = x × y | g_z = g_x + g_y = 0.13 |
z = x / y | g_z = g_x - g_y = 0.07 |
z = y / x | g_z = g_y - g_x = -0.07 |
z = x2 | g_z = 2 × g_x = 0.20 |
z = y1/2 | g_z = 0.5 × g_y = 0.015 |
z = x1/2 y-1/4 | g_z = 0.5 × g_x - 0.25 × g_y = 0.0425 |
U.S. Population, GDP, and Per Capita GDP
Growth Rates and Ratio Scale Visualization
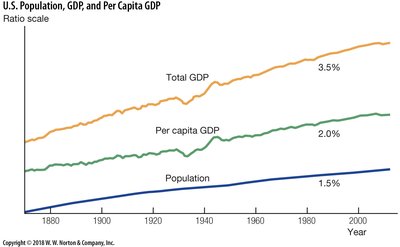
In the United States, total GDP, per capita GDP, and population have grown at different rates. On a ratio scale, these rates are easily compared:
Total GDP: 3.5% per year
Per capita GDP: 2.0% per year
Population: 1.5% per year
Summary and Roadmap
Next Steps in Long-Run Growth Analysis
Subsequent chapters will explore measurement of income differences across countries, the Solow growth model, the role of human capital, labor markets, and determinants of long-run inflation. Understanding these concepts is essential for analyzing the drivers and consequences of economic growth.
Measurement of income levels (Chapter 4)
Solow growth model (Chapter 5)
Human capital and growth (Chapter 6)
Labor market and unemployment (Chapter 7)
Long-run inflation determinants (Chapter 8)
