뒤로
뒤로Job Costing in Managerial Accounting: Structured Study Notes
스터디 가이드 - 스마트 노트
 자료에 맞춘 맞춤형 노트, 핵심 정의, 예시, 맥락을 확장해 제공합니다.
Job Costing: Concepts and Applications
Distinguishing Job Costing from Process Costing
Job costing and process costing are two fundamental methods used to assign costs to products in manufacturing. Understanding their differences is essential for selecting the appropriate costing system for a business.
Process Costing: Used for mass production of identical units through uniform production steps. Costs are averaged across all units produced.
Job Costing: Used for unique, custom-ordered products or small batches. Each product or batch is treated as a separate "job." Examples include custom-home builders, high-end jewelers, and accounting firms.
Key Difference: Job costing tracks costs for individual jobs, while process costing averages costs over many units.
Flow of Production and Tracing Costs
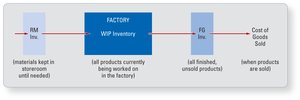
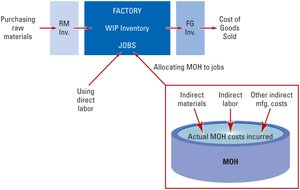
The flow of inventory in a manufacturing system involves tracking materials and labor as they move through production. Direct materials and direct labor are traced to specific jobs, while manufacturing overhead is allocated.
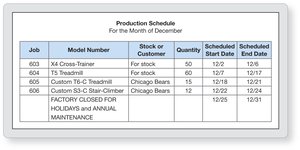
Production Schedule: Management decides which batches to produce, including custom orders and stock inventory.
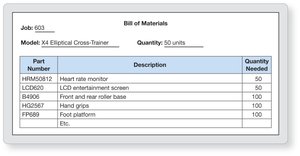
Bill of Materials: Lists all raw materials needed for a job.
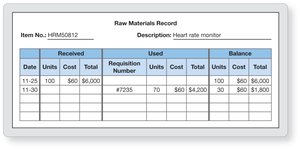
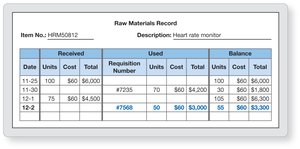
Raw Materials Record: Tracks inventory details for each item.
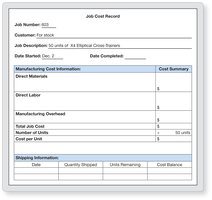
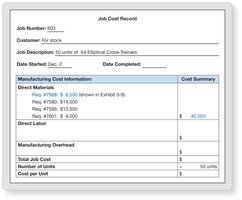
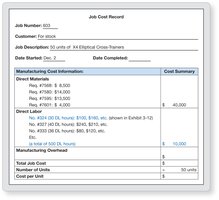
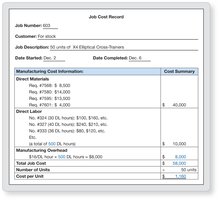
Job Cost Record: Tracks all direct materials, direct labor, and allocated overhead for each job.
Tracing Direct Materials and Labor
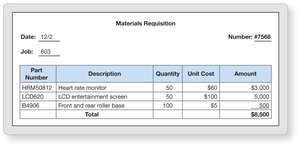
Materials Requisition: Used to request materials for a job.
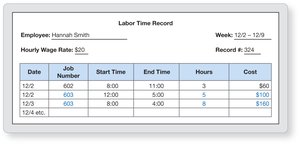
Labor Time Record: Tracks hours worked and labor costs for each job.
Manufacturing Overhead: Allocation and Calculation
Computing Predetermined Manufacturing Overhead Rate
Manufacturing overhead (MOH) includes indirect costs that must be allocated to jobs. The allocation process involves estimating costs and selecting a cost driver.
Step 1: Estimate total MOH costs for the coming year.
Step 2: Select an allocation base (cost driver) and estimate its total usage.
Step 3: Calculate the predetermined MOH rate:
Step 4: Allocate MOH to jobs based on the predetermined rate:
Job Cost Records and Business Decisions
Using Job Cost Records
Job cost records provide detailed information for management to make informed decisions.
Reduce future job costs
Assess and compare profitability
Pricing and discount decisions
Bidding for custom orders
Preparing financial statements
Sustainability and Job Costing
Job cost records help manufacturers track resources and assess environmental impact, employee involvement, and future disposal considerations.
Non-Manufacturing Costs
Include R&D, design, marketing, distribution, and customer service
Assigned to products for internal decision making only
Overallocated and Underallocated Manufacturing Overhead
Definitions and Corrections
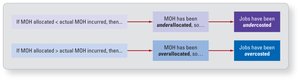
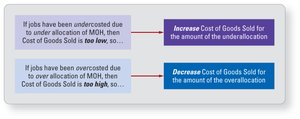
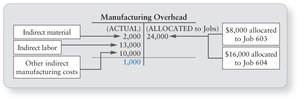
At period end, actual MOH may differ from allocated MOH, resulting in underallocation or overallocation.
Underallocated: Actual MOH > Allocated MOH
Overallocated: Actual MOH < Allocated MOH
Correcting Cost of Goods Sold:
If jobs are undercosted, increase Cost of Goods Sold by the underallocated amount.
If jobs are overcosted, decrease Cost of Goods Sold by the overallocated amount.
Journal Entries in Job Costing
Flow of Costs and Example Entries
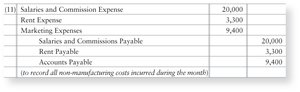
Journal entries record the movement of costs through the manufacturing plant, from purchasing raw materials to closing overhead accounts.
Purchase of raw materials
Use of direct and indirect materials
Use of direct and indirect labor
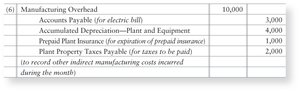
Incurring other MOH costs
Allocating MOH to jobs
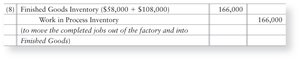
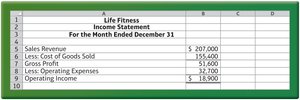
Completion and sale of jobs
Operating expenses
Closing MOH









Job Costing in Service Firms
Assigning Costs and Billing Clients
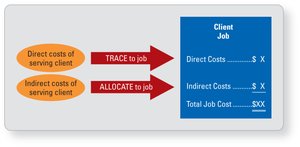
Service firms use job costing to bill clients, tracing direct costs and allocating indirect costs.
Direct Costs: Professional labor traced to client jobs
Indirect Costs: Operating expenses allocated using a predetermined rate
Billing: Add profit markup to total job cost
Robotic Process Automation (RPA) in Job Costing
Role and Benefits of RPA
RPA uses software bots to automate repetitive, rule-based tasks in job costing, improving accuracy and efficiency.
Automates bill of materials creation, inventory updates, labor posting, MOH allocation, and job completion marking
Reduces errors and frees employees for value-added activities
Suitable for tasks with high volume, structured data, and costly consequences for errors
Data Analytics: Using Excel Pivot Tables
Analyzing Job Cost and Profitability Data
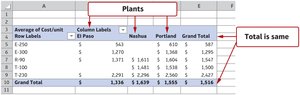
Excel pivot tables are powerful tools for summarizing and analyzing job cost data, allowing managers to view aggregated information by model, plant, or other attributes.
Summarizes and cross-tabulates data
Allows sorting, filtering, and rearranging data
Quick and simple to produce
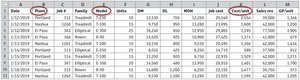
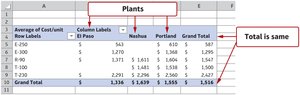
Steps to Create a Pivot Table
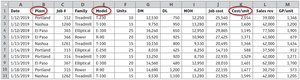
Start with a data set with descriptive column headings
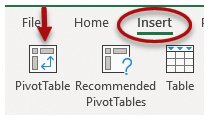
Select any cell, click Insert tab, then PivotTable icon
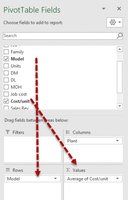
Build the table by dragging fields to Rows, Values, and Columns