1. Reading and Understanding Graphs
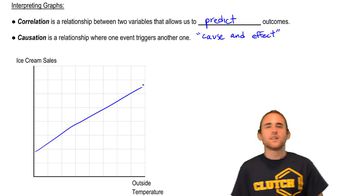
Interpreting Graphs, Correlation, Causation, and Omitted Variables
1. Reading and Understanding Graphs
Interpreting Graphs, Correlation, Causation, and Omitted Variables

 03:02
03:02

다른 창작자들과 함께 배우세요
이 주제를 연습하세요
- 객관식How can being able to read graphs help you in analyzing economic data?163views
- 객관식Suppose a graph shows a positive correlation between ice cream sales and the number of drowning incidents over several months. What is the best conclusion that can be drawn from this graph?144views
- 객관식Based on a graph showing a positive correlation between ice cream sales and drowning incidents, which of the following conclusions is best supported by the information in the graph?154views
- 객관식When interpreting a graph in microeconomics, where can you typically find information about what the graph represents?150views