Microeconomics
나의 코스
배우기
시험 준비
AI 튜터
학습 가이드
플래시카드
탐험해 보세요
앱을 사용해 보세요
나의 코스
배우기
시험 준비
AI 튜터
학습 가이드
플래시카드
탐험해 보세요
앱을 사용해 보세요
뒤로
Using the Supply and Demand Curves to Find Equilibrium definitions
카드를 뒤집기 위해 탭할 수 있습니다.
Equilibrium
카드를 뒤집기 위해 탭할 수 있습니다.
👆
Equilibrium
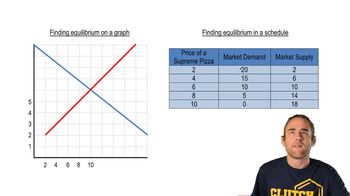
Occurs at the intersection of supply and demand curves, where market balance is achieved and no tendency for price change exists.
진행 상황 추적
컨트롤 버튼이 '내비게이션' 모드로 변경되었습니다.
1/15
관련 플래시카드
관련 실천
추천 영상
Using the Supply and Demand Curves to Find Equilibrium quiz
Using the Supply and Demand Curves to Find Equilibrium
15 용어
Using the Supply and Demand Curves to Find Equilibrium
3. The Market Forces of Supply and Demand
10 문제점
주제
Effects of Surplus
3. The Market Forces of Supply and Demand
10 문제점
주제
3. The Market Forces of Supply and Demand
11 주제
15 문제점
장
VideoThumbView.guidedCourse
04:19
Equilibrium
5800
views
92
rank
VideoThumbView.guidedCourse
06:34
Results of Both Shifting
2462
views
24
rank
VideoThumbView.guidedCourse
06:18
Demand Shifts
3321
views
51
rank
이 집합의 용어 (15)
하이드의 정의
Equilibrium
Occurs at the intersection of supply and demand curves, where market balance is achieved and no tendency for price change exists.
Equilibrium Price
Market value at which quantity supplied matches quantity demanded, denoted as P* and found at the intersection point.
Equilibrium Quantity
Amount exchanged in the market when supply and demand are balanced, labeled as Q* at the intersection.
Supply Curve
Graphical representation showing how producers' willingness to offer goods changes with price, typically slopes upward.
Demand Curve
Graphical line illustrating how buyers' willingness to purchase varies with price, usually slopes downward.
Schedule
Table listing prices alongside corresponding quantities supplied and demanded, used to identify equilibrium without a graph.
Surplus
Situation where quantity supplied exceeds quantity demanded, often resulting in downward pressure on price.
Shortage
Condition where quantity demanded surpasses quantity supplied, typically causing upward pressure on price.
Law of Supply and Demand
Principle stating that market prices adjust to eliminate surpluses and shortages, moving toward equilibrium.
Shift
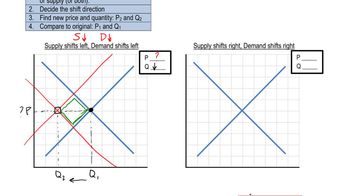
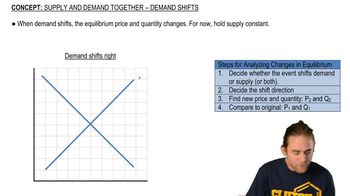
Movement of supply or demand curve due to external factors, altering equilibrium price and quantity.
Double Shift
Simultaneous movement of both supply and demand curves, often resulting in ambiguity for either price or quantity.
Ambiguity
Outcome in double shifts where direction of change for price or quantity cannot be determined without more information.
Notation
Symbols such as P*, Q*, P1, Q1, P2, Q2 used to distinguish original and new equilibrium values after shifts.
Intersection
Point on a graph where supply and demand curves cross, indicating equilibrium conditions.
Input Prices
Costs of resources used in production, changes in which can shift the supply curve and affect equilibrium.