Microeconomics
나의 코스
배우기
시험 준비
AI 튜터
학습 가이드
플래시카드
탐험해 보세요
앱을 사용해 보세요
나의 코스
배우기
시험 준비
AI 튜터
학습 가이드
플래시카드
탐험해 보세요
앱을 사용해 보세요
뒤로
Using the Supply and Demand Curves to Find Equilibrium quiz
카드를 뒤집기 위해 탭할 수 있습니다.
What is market equilibrium in terms of quantity demanded and quantity supplied?
카드를 뒤집기 위해 탭할 수 있습니다.
👆
What is market equilibrium in terms of quantity demanded and quantity supplied?
Market equilibrium occurs when quantity demanded equals quantity supplied.
진행 상황 추적
컨트롤 버튼이 '내비게이션' 모드로 변경되었습니다.
1/15
관련 플래시카드
관련 실천
추천 영상
Using the Supply and Demand Curves to Find Equilibrium definitions
Using the Supply and Demand Curves to Find Equilibrium
15 용어
Using the Supply and Demand Curves to Find Equilibrium
3. The Market Forces of Supply and Demand
10 문제점
주제
Effects of Surplus
3. The Market Forces of Supply and Demand
10 문제점
주제
3. The Market Forces of Supply and Demand
11 주제
15 문제점
장
VideoThumbView.guidedCourse
04:19
Equilibrium
5804
views
92
rank
VideoThumbView.guidedCourse
06:34
Results of Both Shifting
2466
views
24
rank
VideoThumbView.guidedCourse
06:18
Demand Shifts
3324
views
51
rank
이 집합의 용어 (15)
하이드의 정의
What is market equilibrium in terms of quantity demanded and quantity supplied?
Market equilibrium occurs when quantity demanded equals quantity supplied.
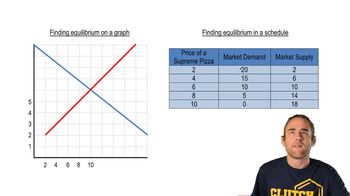
How do you identify the equilibrium price and quantity on a supply and demand graph?
The equilibrium price and quantity are found at the intersection point of the supply and demand curves.
What notation is commonly used for equilibrium price and equilibrium quantity?
Equilibrium price is denoted as P* (P star) and equilibrium quantity as Q* (Q star).
What happens in the market if the price is set above the equilibrium price?
If the price is above equilibrium, there is excess supply (a surplus), leading suppliers to lower prices.
What does the law of supply and demand state about price adjustments?
The law of supply and demand states that prices will adjust until the market reaches equilibrium.
How can equilibrium be found using a schedule (table) of prices and quantities?
Equilibrium is found where the quantity supplied equals the quantity demanded at a specific price in the schedule.
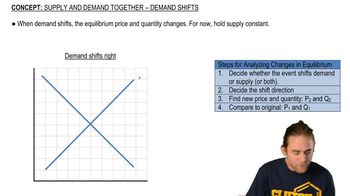
What is the effect on equilibrium price and quantity when demand shifts to the right?
When demand shifts to the right, equilibrium price and equilibrium quantity both increase.
What happens to equilibrium price and quantity when demand shifts to the left?
When demand shifts to the left, both equilibrium price and equilibrium quantity decrease.
If supply shifts to the right, what is the effect on equilibrium price and quantity?
A rightward shift in supply decreases equilibrium price and increases equilibrium quantity.
What is the result of a leftward shift in the supply curve on equilibrium?
A leftward shift in supply increases equilibrium price and decreases equilibrium quantity.
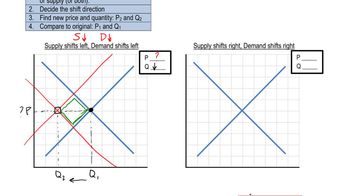
When both supply and demand shift, why is one variable considered ambiguous?
One variable (either price or quantity) is ambiguous because the direction of its change depends on the relative size of the shifts.
If both supply and demand shift to the right equally, what happens to equilibrium price and quantity?
Quantity definitely increases, but the change in price is ambiguous.
When supply shifts left and demand shifts right, which variable is ambiguous and which is certain?
Quantity is ambiguous, but price definitely increases.
What is the recommended method for analyzing double shifts in supply and demand?
Draw both curves shifted by equal amounts to easily identify which variable is ambiguous.
Why is using a graph helpful when analyzing shifts in supply and demand?
Using a graph provides a clear visual understanding of how equilibrium price and quantity change with shifts.