 뒤로
뒤로Applying the Competitive Model: Welfare Analysis and Policy Impacts
스터디 가이드 - 스마트 노트
 자료에 맞춘 맞춤형 노트, 핵심 정의, 예시, 맥락을 확장해 제공합니다.
Applying the Competitive Model
Zero Profit for Firms in the Long Run
In perfectly competitive markets, firms experience zero economic profit in the long run due to free entry and exit. This outcome ensures that resources are allocated efficiently and that firms earn a normal profit, which is the opportunity cost of capital.
Economic Profit: The difference between total revenue and total costs, including opportunity costs.
Normal Profit: The minimum profit necessary to keep a firm in business, equal to the opportunity cost of capital.
Shutdown Rule: Firms will operate in the long run even at zero profit because they are earning what they could elsewhere.
Zero Long-Run Profit When Entry Is Limited
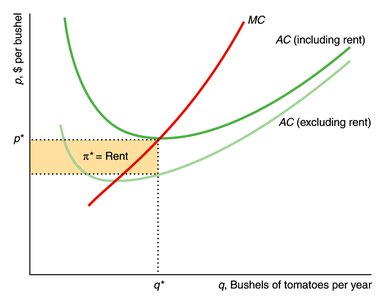
When entry is restricted, firms may earn rent, which is a payment above the minimum required to keep a factor in its current use.
Rent: Payment to the owner of an input beyond the minimum necessary for supply.
Consumer Welfare
Consumer welfare is measured by the benefit consumers receive from purchasing goods, minus the amount paid. The demand curve reflects a consumer’s marginal willingness to pay for each unit.
Marginal Willingness to Pay: The maximum amount a consumer will spend for an extra unit.
Consumer Surplus (CS): The monetary difference between what a consumer is willing to pay and what they actually pay.

Measuring Consumer Surplus
Consumer surplus is the area under the demand curve and above the market price, up to the quantity purchased.
Individual CS: Area under individual demand curve above price.
Market CS: Area under market demand curve above price.
Effect of Price Changes on Consumer Surplus
When prices rise due to supply shifts or taxes, consumer surplus decreases.

Markets with Large Consumer Surplus Losses
Consumer surplus falls more when:
Initial revenues spent on the good are high.
Demand is less elastic.

Elasticity and Consumer Surplus Loss
Price increases cause larger consumer surplus losses in markets with less elastic demand.

Producer Welfare
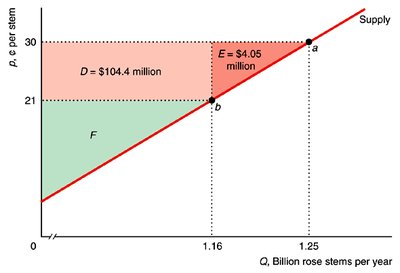
Producer welfare is measured by producer surplus, which is the difference between the amount a good sells for and the minimum amount necessary for production.
Producer Surplus (PS): Area above the supply curve and below the market price up to the quantity produced.
PS Formula: (where R is revenue, VC is variable cost).
Difference from Profit: Fixed cost (F) separates producer surplus from profit.

Measuring Producer Surplus

Effect of Price Changes on Producer Surplus
When prices fall, producer surplus decreases.

Competition Maximizes Welfare
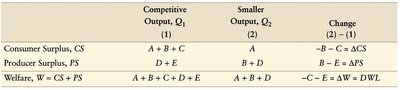
Social welfare is maximized in competitive markets, where the sum of consumer and producer surplus is greatest.
Welfare Formula:
Deadweight Loss (DWL)
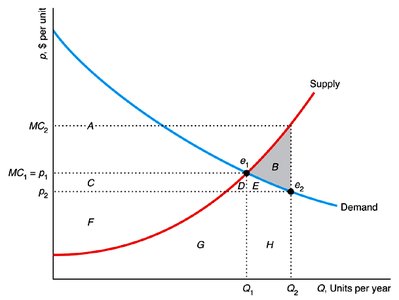
Deadweight loss is the net reduction in welfare from a loss of surplus that is not offset by a gain elsewhere. It occurs when output is reduced below or increased above the competitive equilibrium.
DWL: Occurs when consumers value extra output more than its marginal cost, or when extra output costs more than its value to consumers.



Policies That Shift Supply Curves
Government policies can affect competitive equilibrium by shifting supply or demand curves, or by creating a wedge between price and marginal cost.
Supply Shifts: Limits on number of firms or quotas on output.
Entry Barriers: Explicit restrictions or costs that apply only to new firms.
Exit Barriers: Restrictions that make it difficult for firms to leave the market.
Restricting the Number of Firms
Limiting the number of firms shifts supply left, raising price and reducing quantity. Consumers lose, but incumbent firms benefit.
Raising Entry and Exit Costs
Large sunk costs and poorly functioning capital markets can prevent entry, while exit barriers discourage firms from leaving.
Welfare Effects of a Sales Tax
A sales tax raises the price consumers pay and lowers the price firms receive, reducing both consumer and producer surplus. Tax revenue is added to welfare if used productively.
Welfare Formula with Tax:
Change in Welfare:

Welfare Effects of a Subsidy
A subsidy is a negative tax, increasing equilibrium quantity and price received by producers, but requiring government expenditure.
Welfare Effects of Price Controls
Price Floor
A price floor set above equilibrium causes excess supply and reduces consumer surplus.

Price Ceiling
A price ceiling set below equilibrium causes excess demand and reduces producer surplus.
Comparing Import Policies
Governments can allow free trade, ban imports, set quotas, or impose tariffs. Tariffs are taxes on imports, while quotas limit quantity.
Specific Tariff: Fixed amount per unit.
Ad Valorem Tariff: Percentage of sales price.
Quota: Restricts quantity, but does not generate government revenue.
Rent Seeking
Rent seeking refers to efforts and expenditures to gain profit from government actions, such as tariffs or quotas, which benefit domestic producers at the expense of overall welfare.
