 뒤로
뒤로Consumer Behavior, Budget Constraints, and Elasticity in Microeconomics
스터디 가이드 - 스마트 노트
 자료에 맞춘 맞춤형 노트, 핵심 정의, 예시, 맥락을 확장해 제공합니다.
Consumer Behavior
The Buyer's Problem
Consumer behavior in microeconomics is centered around the buyer's problem, which involves making optimal choices given preferences, prices, and budget constraints. The buyer's problem can be broken down into three main components:
Preferences: What the consumer likes or values among available goods and services.
Prices: The cost of goods and services, assumed to be fixed and non-negotiable in basic models.
Budget: The total amount of money available for spending, with no saving or borrowing allowed in the short run.
Consumers are assumed to be rational, seeking to maximize their utility (satisfaction) given these constraints.
Budget Constraints and Opportunity Cost
Budget Set and Budget Line
The budget set represents all possible combinations of goods a consumer can afford, while the budget line shows the combinations that exactly exhaust the consumer's budget. The equation for a budget constraint with two goods (e.g., jeans and sweaters) is:
where j is the quantity of jeans, s is the quantity of sweaters, and $300 is the total budget.
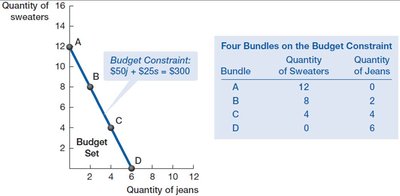
The slope of the budget line represents the opportunity cost of one good in terms of the other. For example, the opportunity cost of one pair of jeans is the number of sweaters forgone to buy an additional pair of jeans.
Opportunity Cost
Opportunity Cost of Jeans:
Opportunity Cost of Sweaters:
Marginal Analysis and Consumer Equilibrium
Marginal Benefit and Marginal Cost
Consumers make decisions at the margin, comparing the marginal benefit (MB) of consuming an additional unit of a good to its marginal cost (MC). The optimal consumption bundle is where the marginal benefit per dollar is equalized across all goods:
subject to the budget constraint.
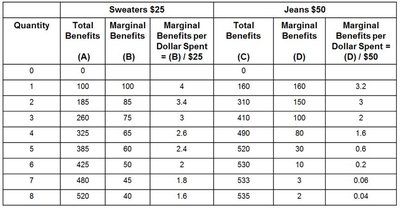
Graphical Analysis of Budget Constraints
Shifts and Pivots in the Budget Line
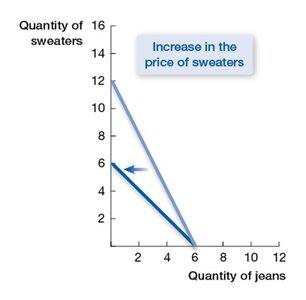
Price Increase: An increase in the price of one good pivots the budget line inward, reducing the affordable quantity of that good.
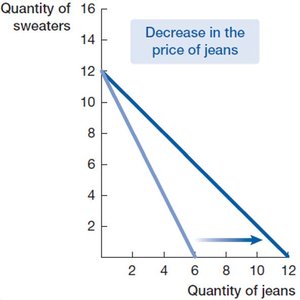
Price Decrease: A decrease in the price pivots the budget line outward, increasing the affordable quantity.
Income Increase: An increase in income shifts the budget line outward in a parallel fashion, allowing more of both goods to be purchased.
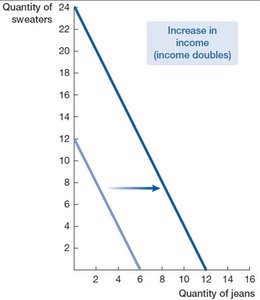
From Budget Constraints to Demand Curves
Individual Demand Curve
An individual's demand curve shows the relationship between the price of a good and the quantity demanded, holding other factors constant. It reflects both the consumer's willingness and ability to pay.
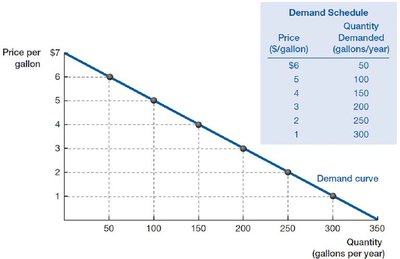
As the price decreases, the quantity demanded increases, resulting in a downward-sloping demand curve.
Consumer Surplus
Definition and Calculation
Consumer surplus is the difference between what a consumer is willing to pay for a good and what they actually pay. It is a measure of consumer well-being and is represented graphically as the area between the demand curve and the market price, up to the quantity purchased.
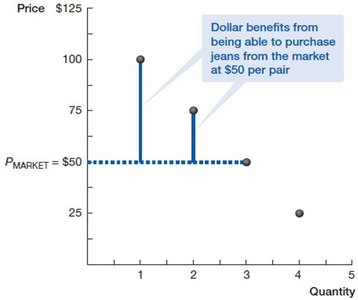
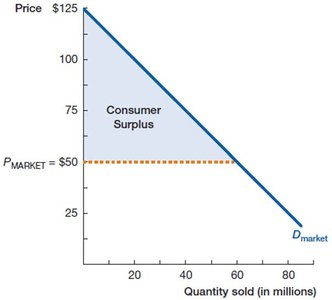
For a linear demand curve, consumer surplus can be calculated as the area of a triangle:
Preferences and Utility Functions
Utility and Indifference Curves
Utility functions represent consumer preferences mathematically. An indifference curve shows all combinations of two goods that provide the same level of utility to the consumer. Higher indifference curves represent higher utility levels.
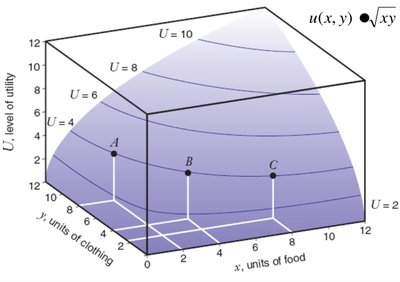
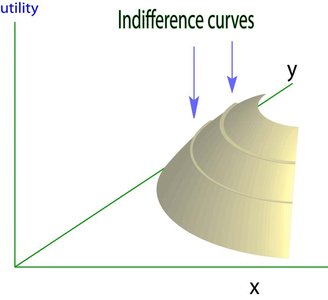
The slope of an indifference curve is the marginal rate of substitution (MRS), which equals the ratio of the marginal utilities of the two goods:
Elasticity
Price Elasticity of Demand
Elasticity measures the responsiveness of one variable to changes in another. The price elasticity of demand is defined as:
Where is the percentage change in quantity demanded and is the percentage change in price.
Elastic Demand:
Inelastic Demand:
Unit Elastic:
Arc Elasticity
Arc elasticity provides a stable measure of elasticity over a range of prices and quantities by using average values:
Determinants of Elasticity
Availability of substitutes
Share of budget spent on the good
Time horizon for adjustment
Cross-Price and Income Elasticity
Cross-Price Elasticity: Measures how the quantity demanded of one good responds to a price change in another good.
Income Elasticity: Measures how the quantity demanded changes as consumer income changes.
Interpretation:
Positive cross-price elasticity: Substitutes
Negative cross-price elasticity: Complements
Positive income elasticity: Normal goods
Negative income elasticity: Inferior goods
Summary Table: Elasticity Types and Interpretation
Elasticity Type | Formula | Interpretation |
|---|---|---|
Price Elasticity of Demand | Responsiveness of quantity demanded to price changes | |
Cross-Price Elasticity | Substitutes (), Complements () | |
Income Elasticity | Normal (), Inferior () |
Additional info: These notes synthesize and expand upon the provided lecture slides and textbook images, ensuring a comprehensive and academically rigorous overview of consumer behavior, budget constraints, and elasticity in microeconomics.
