 뒤로
뒤로Consumer Behavior, Budget Constraints, and Elasticity in Microeconomics
스터디 가이드 - 스마트 노트
 자료에 맞춘 맞춤형 노트, 핵심 정의, 예시, 맥락을 확장해 제공합니다.
Consumer Behavior and the Buyer's Problem
Understanding the Buyer's Problem
The buyer’s problem in microeconomics involves making optimal choices given preferences, prices, and budget constraints. Consumers aim to maximize their well-being by choosing the best combination of goods and services within their financial limits.
Preferences: What consumers like or value, reflected in their choices.
Prices: The cost of goods and services, assumed to be fixed in basic models.
Budget: The total amount of money available for spending, with no saving or borrowing allowed in the basic model.
Optimization and Marginal Analysis
Consumers make decisions at the margin, comparing the additional benefit of consuming one more unit of a good to its cost. The optimal choice is where the marginal benefit per dollar is equalized across all goods, subject to the budget constraint.
Marginal Benefit (MB): The extra satisfaction from consuming one more unit.
Marginal Cost (MC): The price of the additional unit.
Optimization Rule: for goods x and y.
Budget Constraints and Opportunity Cost
Budget Set and Budget Line
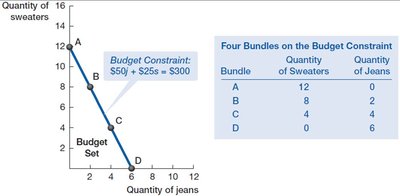
The budget set includes all combinations of goods a consumer can afford. The budget line shows the maximum possible combinations of two goods given their prices and the consumer’s income.
Budget Constraint Equation:
Slope of Budget Line: , representing the opportunity cost of one good in terms of the other.
Opportunity Cost
Opportunity cost is the value of the next best alternative forgone when making a choice. For two goods, it is the ratio of their prices.
Opportunity Cost of Good X:
Opportunity Cost of Good Y:
Consumer Equilibrium and Utility Maximization
Consumer Equilibrium Condition
Consumer equilibrium is achieved when the consumer allocates their budget such that the marginal utility per dollar spent is equal for all goods, and the budget is fully exhausted.
Equilibrium Condition:
Budget Exhaustion:
Utility Functions and Indifference Curves
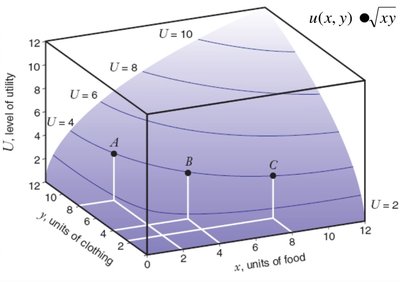
Utility functions represent consumer preferences mathematically. Indifference curves show combinations of goods that provide the same level of satisfaction.
Utility Function:
Indifference Curve: A curve connecting bundles with equal utility.
Marginal Rate of Substitution (MRS): The slope of the indifference curve,
Demand Curves and Consumer Surplus
Individual Demand Curve
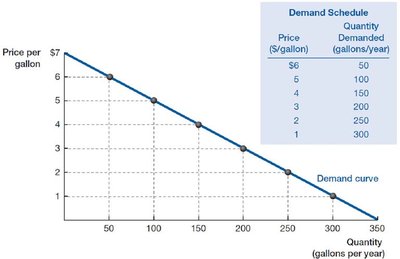
The demand curve shows the relationship between the price of a good and the quantity demanded, holding other factors constant. It is typically downward sloping due to diminishing marginal utility.
Law of Demand: As price decreases, quantity demanded increases.
Inverse Demand Function: Expresses price as a function of quantity demanded.
Consumer Surplus
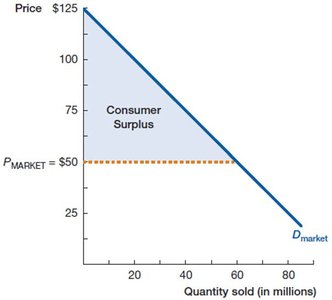
Consumer surplus is the difference between what consumers are willing to pay for a good and what they actually pay. It measures the net benefit to consumers from market transactions.
Calculation: Area between the demand curve and the market price, up to the quantity purchased.
Formula for a Triangle:
Elasticity of Demand
Price Elasticity of Demand
Price elasticity of demand measures how much the quantity demanded responds to a change in price. It is calculated as the percentage change in quantity demanded divided by the percentage change in price.
Formula:
Interpretation:
: Elastic demand
: Inelastic demand
: Unit elastic
Arc Elasticity
Arc elasticity provides a measure of elasticity over a range of prices and quantities, using the average values as the base for percentage changes.
Arc Elasticity Formula:
Determinants of Elasticity
Availability of substitutes
Share of budget spent on the good
Time horizon for adjustment
Income and Cross-Price Elasticity
Income Elasticity of Demand
Income elasticity measures how quantity demanded changes as consumer income changes.
Formula:
Interpretation:
: Luxury good
: Necessity
: Inferior good
Cross-Price Elasticity of Demand
Cross-price elasticity measures how the quantity demanded of one good responds to a change in the price of another good.
Formula:
Interpretation:
: Substitutes
: Complements
: Independent goods
Applications and Examples
Budget Constraint Example: Jeans and Sweaters
Suppose jeans cost . The table below shows possible combinations (bundles) of jeans and sweaters that exhaust the budget.
Bundle | Quantity of Sweaters | Quantity of Jeans |
|---|---|---|
A | 12 | 0 |
B | 8 | 2 |
C | 4 | 4 |
D | 0 | 6 |
Marginal Benefit Table Example
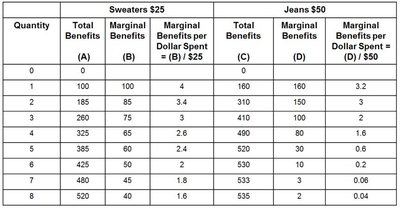
The following table shows the total and marginal benefits for sweaters and jeans, as well as the marginal benefit per dollar spent. This helps in determining the optimal consumption bundle.
Quantity | Total Benefits (Sweaters) | Marginal Benefits (Sweaters) | Marginal Benefits per Dollar (Sweaters) | Total Benefits (Jeans) | Marginal Benefits (Jeans) | Marginal Benefits per Dollar (Jeans) |
|---|---|---|---|---|---|---|
0 | 0 | - | - | 0 | - | - |
1 | 100 | 100 | 4.0 | 160 | 160 | 3.2 |
2 | 185 | 85 | 3.4 | 310 | 150 | 3.0 |
3 | 260 | 75 | 3.0 | 410 | 100 | 2.0 |
4 | 325 | 65 | 2.6 | 490 | 80 | 1.6 |
5 | 385 | 60 | 2.4 | 520 | 30 | 0.6 |
6 | 425 | 40 | 1.6 | 530 | 10 | 0.2 |
7 | 480 | 55 | 2.2 | 533 | 3 | 0.06 |
8 | 520 | 40 | 1.6 | 535 | 2 | 0.04 |
Summary Table: Elasticity Types and Interpretation
Elasticity Type | Formula | Interpretation |
|---|---|---|
Price Elasticity of Demand | Measures responsiveness of quantity demanded to price changes | |
Income Elasticity of Demand | Measures responsiveness of quantity demanded to income changes | |
Cross-Price Elasticity of Demand | Measures responsiveness of quantity demanded for one good to price changes in another good |
Additional info: These notes cover core concepts from Chapters 5 and 7 of a typical microeconomics curriculum, including consumer choice, budget constraints, marginal analysis, demand curves, consumer surplus, and elasticity. The tables and images reinforce the mathematical and graphical analysis of consumer behavior and market outcomes.
