 뒤로
뒤로Demand and Supply: Foundations of Market Equilibrium
스터디 가이드 - 스마트 노트
 자료에 맞춘 맞춤형 노트, 핵심 정의, 예시, 맥락을 확장해 제공합니다.
Demand and Supply'
Introduction to Demand and Supply
Understanding how prices and quantities are determined in competitive markets is central to microeconomics. The interaction of demand and supply explains how resources are allocated and how market equilibrium is achieved.
Demand
The Law of Demand
The law of demand states that, other things remaining the same, the higher the price of a good, the lower the quantity demanded; and the lower the price, the higher the quantity demanded. This negative relationship is fundamental to consumer behavior.
Substitution Effect: When the price of a good rises, consumers seek substitutes, decreasing the quantity demanded.
Income Effect: A higher price reduces consumers' purchasing power, leading to a decrease in quantity demanded.
The demand curve graphically represents this relationship, typically sloping downward from left to right.
Determinants of Demand
Demand can change due to factors other than the good's own price. These include:
Prices of related goods (substitutes and complements)
Expected future prices
Income
Expected future income and credit
Population
Preferences
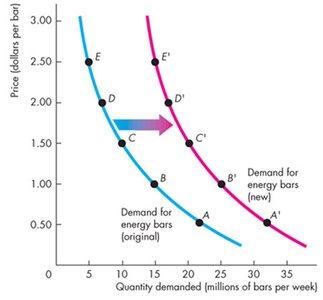
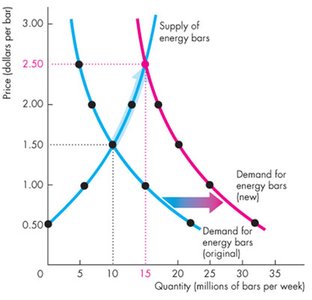
A change in any of these factors shifts the demand curve. An increase in demand shifts the curve rightward; a decrease shifts it leftward.
Movement Along vs. Shift of the Demand Curve
Movement along the curve: Caused by a change in the good's own price.
Shift of the curve: Caused by changes in other determinants (e.g., income, preferences).
Supply
The Law of Supply
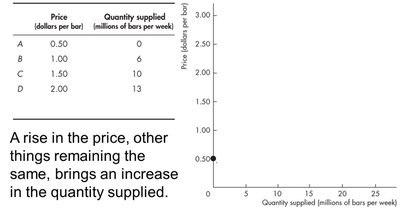
The law of supply states that, other things remaining the same, the higher the price of a good, the greater the quantity supplied; and the lower the price, the smaller the quantity supplied. This positive relationship reflects producers' willingness to supply more at higher prices.
Equation: If P is price and Qs is quantity supplied, the law can be written as and .
The supply curve is typically upward sloping.
Determinants of Supply
Supply can change due to factors other than the good's own price. These include:
Prices of factors of production
Prices of related goods produced
Expected future prices
Number of suppliers
Technology
State of nature
A change in any of these factors shifts the supply curve. An increase in supply shifts the curve rightward; a decrease shifts it leftward.
Movement Along vs. Shift of the Supply Curve
Movement along the curve: Caused by a change in the good's own price.
Shift of the curve: Caused by changes in other determinants (e.g., technology, input prices).
Market Equilibrium
Determination of Equilibrium Price and Quantity
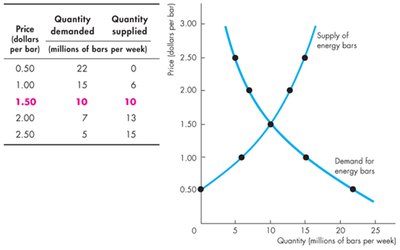
Market equilibrium occurs where the quantity demanded equals the quantity supplied. The price at this point is the equilibrium price, and the quantity is the equilibrium quantity. At equilibrium, there is neither a shortage nor a surplus.
Surplus and Shortage
Surplus: Occurs when quantity supplied exceeds quantity demanded at a given price. This puts downward pressure on price.
Shortage: Occurs when quantity demanded exceeds quantity supplied at a given price. This puts upward pressure on price.
Graphical Representation of Equilibrium
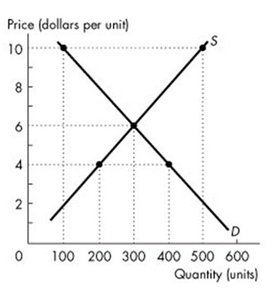
The intersection of the demand and supply curves on a graph shows the equilibrium price and quantity.
Shifts in Demand and Supply: Predicting Changes
Effects of Changes in Demand and Supply
Increase in demand: Raises equilibrium price and quantity.
Decrease in demand: Lowers equilibrium price and quantity.
Increase in supply: Lowers equilibrium price and raises equilibrium quantity.
Decrease in supply: Raises equilibrium price and lowers equilibrium quantity.
Simultaneous changes in demand and supply can have complex effects on equilibrium price and quantity, depending on the magnitude and direction of the shifts.
Shifts in the Demand Curve
For example, an increase in income (for a normal good) or an increase in the price of a substitute shifts the demand curve to the right.
Shifts in Both Demand and Supply
If demand increases and supply decreases simultaneously, the equilibrium price will rise, but the effect on equilibrium quantity depends on the relative magnitude of the shifts.
Key Concepts and Definitions
Normal good: Demand increases as income increases.
Inferior good: Demand decreases as income increases.
Substitute goods: Goods that can replace each other; an increase in the price of one increases demand for the other.
Complement goods: Goods that are used together; an increase in the price of one decreases demand for the other.
Worked Examples and Applications
Example: Calculating Equilibrium
Suppose the demand curve is and the supply curve is . To find equilibrium:
Set :
Substitute back into either equation to find :
So, equilibrium price is $10, equilibrium quantity is 500 units.
Example: Interpreting a Table of Market Data
Price (dollars per unit) | Quantity Demanded (units) | Quantity Supplied (units) |
|---|---|---|
1 | 1,100 | 50 |
2 | 800 | 200 |
3 | 600 | 420 |
4 | 500 | 500 |
5 | 420 | 580 |
6 | 350 | 640 |
7 | 320 | 680 |
8 | 300 | 700 |
At a price of $4, quantity demanded equals quantity supplied (500 units), so the market is in equilibrium.
Summary Table: Factors Affecting Demand and Supply
Factor | Effect on Demand | Effect on Supply |
|---|---|---|
Price of the good | Movement along curve | Movement along curve |
Income | Shifts curve (normal/inferior goods) | No direct effect |
Prices of related goods | Shifts curve (substitutes/complements) | Shifts curve (related goods produced) |
Technology | No direct effect | Shifts curve (improves supply) |
Number of buyers/sellers | Shifts curve (population) | Shifts curve (number of suppliers) |
Additional info: This guide expands on the provided notes with definitions, equations, and examples to ensure a comprehensive understanding of demand, supply, and market equilibrium for microeconomics students.
