 뒤로
뒤로Efficiency and Equity: Resource Allocation, Surplus, and Market Failure
스터디 가이드 - 스마트 노트
 자료에 맞춘 맞춤형 노트, 핵심 정의, 예시, 맥락을 확장해 제공합니다.
Efficiency and Equity
Resource Allocation Methods
Scarce resources can be allocated in several ways, each with distinct mechanisms and implications for efficiency and fairness. Understanding these methods is fundamental to microeconomics.
Market Price: Resources are allocated to those willing to pay the market price. Most goods and services are distributed this way, and it is generally efficient for most markets.
Command: Allocation occurs by the order of someone in authority, such as managers in firms. This method works well in organizations but poorly in entire economies.
Majority Rule: Resources are allocated according to the preferences of the majority, often used for public goods and major societal decisions.
Contest: Winners of a competition receive the resource, common in sports and awards.
First-Come, First-Served: Resources go to those who arrive first, suitable for sequentially consumed goods like restaurant tables.
Force: Resources are allocated through coercion or theft, which is generally inefficient and unfair.
Benefit, Cost, and Surplus
Demand, Willingness to Pay, and Value
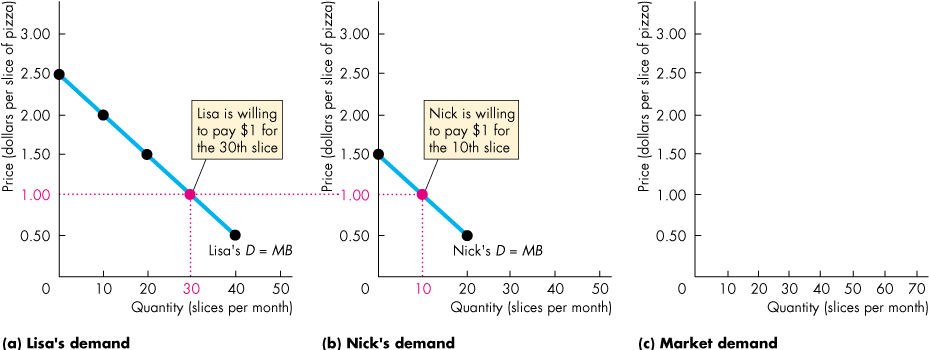
The value of a good is the maximum price a person is willing to pay, which is also its marginal benefit. The demand curve represents the marginal benefit curve, showing the relationship between price and quantity demanded.
Individual Demand and Market Demand
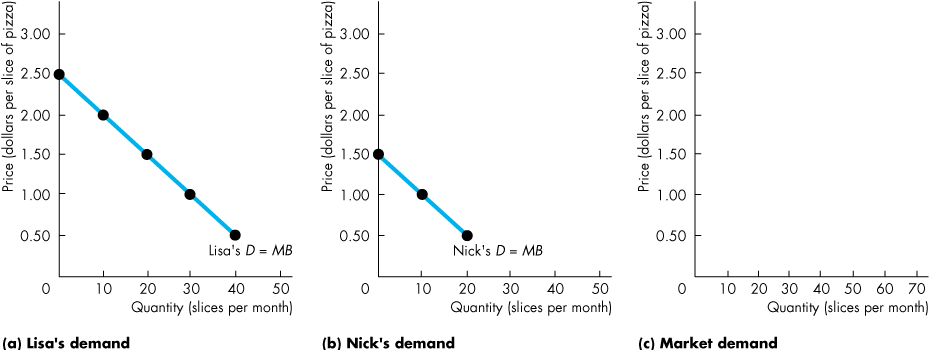
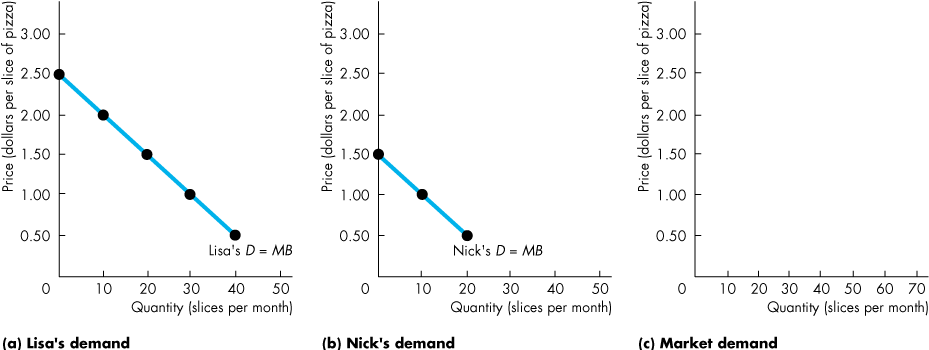
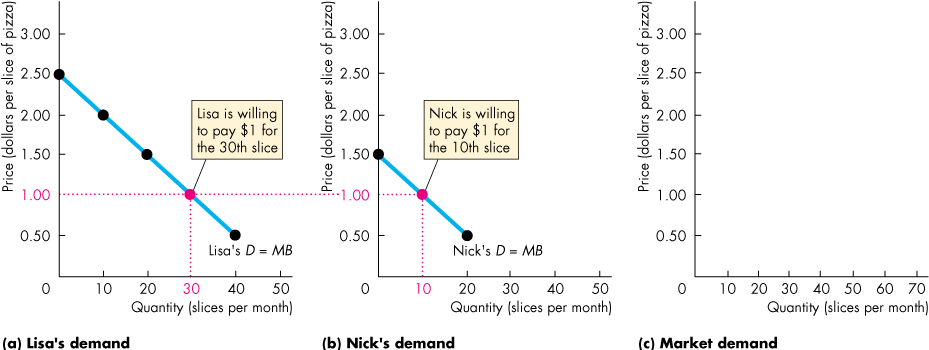
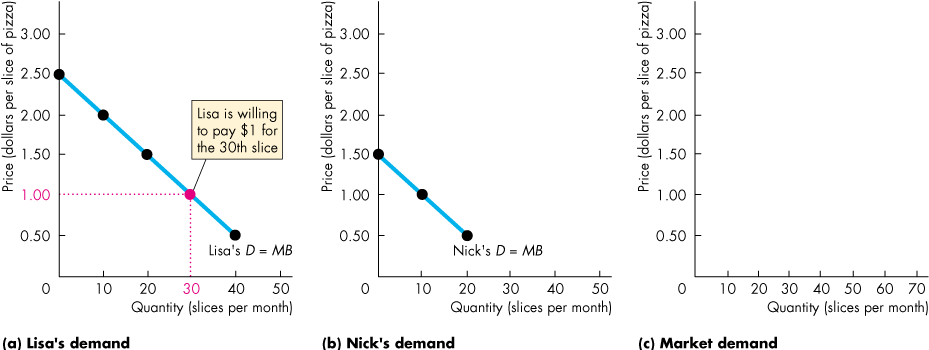
Individual demand refers to the quantity of a good a single consumer will buy at various prices, while market demand is the total quantity demanded by all consumers at each price. The market demand curve is the horizontal sum of individual demand curves.
Individual Demand: Shows how much one person will buy at each price.
Market Demand: Aggregates all individual demands in the market.
Consumer Surplus
Consumer surplus is the difference between the total benefit received from a good and the total amount paid for it. It is calculated as the area under the demand curve and above the market price, up to the quantity bought.
Formula:
Graphical Representation: Area under the demand curve and above the price line.
Producer Surplus
Producer surplus is the difference between the amount received from selling a good and the cost of producing it. It is shown as the area below the market price and above the supply curve, summed over the quantity sold.
Formula:
Graphical Representation: Area below the price line and above the supply curve.
Efficiency of Competitive Equilibrium
Conditions for Efficiency
A competitive market is efficient when the quantity demanded equals the quantity supplied at equilibrium. Efficiency is achieved when marginal social benefit (MSB) equals marginal social cost (MSC).
When production is less than equilibrium, MSB > MSC (underproduction).
When production is greater than equilibrium, MSC > MSB (overproduction).
At equilibrium, MSC = MSB.
Total Surplus
Total surplus is the sum of consumer surplus and producer surplus. It is maximized at the efficient quantity.
Formula:
Market Failure
Definition and Causes
Market failure occurs when a market does not allocate resources efficiently, resulting in underproduction or overproduction. The main sources of market failure include:
Price and Quantity Regulations: Government-imposed limits can restrict efficient allocation.
Taxes and Subsidies: Taxes reduce production (underproduction), subsidies increase production (overproduction).
Externalities: Costs or benefits affecting third parties, such as pollution (external cost) or smoke detectors (external benefit).
Public Goods and Common Resources: Non-excludable goods can lead to inefficiency.
Monopoly: Single sellers restrict output to maximize profit, causing underproduction.
High Transactions Costs: When the cost of making trades is too high, markets may not operate efficiently.
Deadweight Loss
Deadweight loss is the reduction in total surplus that results from inefficient production levels. It is represented by the area between the efficient quantity and the actual quantity produced.
Underproduction: Producing less than the efficient quantity creates deadweight loss.
Overproduction: Producing more than the efficient quantity also creates deadweight loss.
Summary Table: Resource Allocation Methods
Method | How It Works | Efficiency | Example |
|---|---|---|---|
Market Price | Allocated to those willing to pay | Generally efficient | Labor market, retail goods |
Command | Allocated by authority | Efficient in organizations | Corporate management |
Majority Rule | Allocated by majority vote | Efficient for public goods | Government spending |
Contest | Allocated to winners | Efficient for hard-to-monitor efforts | Sports, awards |
First-Come, First-Served | Allocated to first arrivals | Efficient for sequential goods | Restaurant tables |
Force | Allocated by coercion | Inefficient | Theft, war |
Key Formulas
Consumer Surplus:
Producer Surplus:
Total Surplus:
Example: Pizza Market
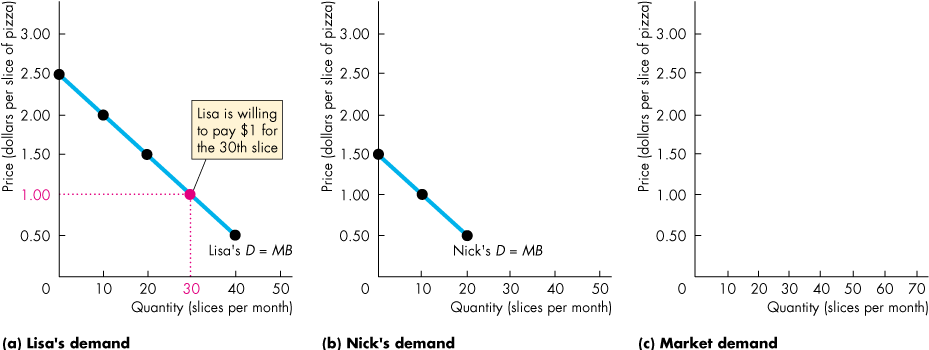
Consider Lisa and Nick as buyers in the pizza market. At $1 per slice, Lisa buys 30 slices and Nick buys 10 slices, so the market demand is 40 slices. Their consumer surplus is the area under their demand curves above the price line.
Conclusion
Efficient allocation of resources maximizes total surplus, but market failures can lead to deadweight losses. Understanding the mechanisms of allocation, surplus, and market failure is essential for evaluating the performance and fairness of markets in microeconomics.
