 뒤로
뒤로Markets, Efficiency, and Equity: Surplus, Allocation, and Fairness in Microeconomics
스터디 가이드 - 스마트 노트
 자료에 맞춘 맞춤형 노트, 핵심 정의, 예시, 맥락을 확장해 제공합니다.
Markets, Efficiency, and Equity
Consumer Surplus and Marginal Benefit
The demand curve in microeconomics represents the marginal benefit that consumers receive from purchasing a good. Understanding consumer surplus is essential for analyzing how much benefit consumers gain from market transactions.
Individual Demand: Shows the relationship between the price of a good and the quantity demanded by one person.
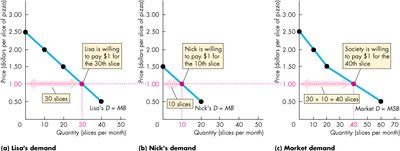
Market Demand: Represents the total quantity demanded by all buyers at each price; it is the horizontal sum of individual demand curves.
Consumer Surplus: The excess of the benefit received from a good over the amount paid for it. It is calculated as the area between the demand curve and the market price, up to the quantity purchased.
Formula: (where b is the base and h is the height of the surplus triangle on a graph).
Marginal Benefit: The additional benefit received from consuming one more unit of a good.
Example: If Lisa is willing to pay $1 for her 30th slice of pizza, and Nick is willing to pay $1 for his 10th slice, the market demand curve aggregates these individual demands.
Producer Surplus and Marginal Cost
The supply curve represents the marginal cost of production for firms. Producer surplus measures the benefit producers receive from selling at a market price higher than their minimum acceptable price.
Individual Supply: The relationship between the price of a good and the quantity supplied by one producer.
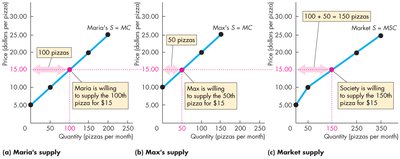
Market Supply: The total quantity supplied by all producers at each price; it is the horizontal sum of individual supply curves.
Marginal Cost: The cost of producing one more unit of a good; it is the minimum price a firm is willing to accept.
Producer Surplus: The excess of the amount received from the sale of a good over the cost of producing it. It is calculated as the area above the supply curve and below the market price, up to the quantity sold.
Formula: (where b is the base and h is the height of the surplus triangle on a graph).
Example: If Maria is willing to supply the 100th pizza for $15, and Max is willing to supply the 50th pizza for $15, the market supply curve aggregates these individual supplies.
Efficiency of Competitive Equilibrium
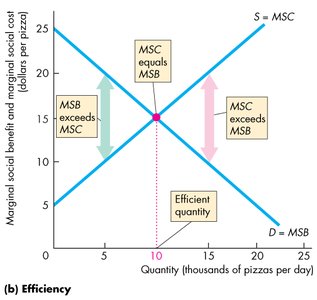
A competitive market achieves an efficient allocation of resources when the quantity demanded equals the quantity supplied at equilibrium. Efficiency is determined by comparing marginal social benefit (MSB) and marginal social cost (MSC).
Efficient Quantity: Occurs when .
Underproduction: If production is less than equilibrium, (shortage).
Overproduction: If production is greater than equilibrium, (surplus).
Total Surplus: .
Market Failure and Deadweight Loss
Markets do not always achieve efficient outcomes. Market failure occurs when total surplus is not maximized, often due to underproduction or overproduction. Deadweight loss is the reduction in total surplus resulting from inefficiency.
Sources of Market Failure:
Price and quantity regulations (price ceilings, price floors, quotas)
Taxes (can cause underproduction)
Subsidies (can cause overproduction)
Externalities (costs or benefits to third parties)
Public goods and common resources
Monopoly (single firm market structure)
High transaction costs
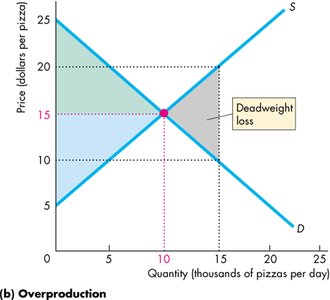
Deadweight Loss: The decrease in total surplus, represented by the area of inefficiency (gray triangle) on a supply and demand graph.
Example: If the efficient quantity of pizzas is 10,000 per day, producing 15,000 leads to overproduction and deadweight loss; producing 5,000 leads to underproduction and deadweight loss.
Alternative Methods for Allocating Scarce Resources
When markets are inefficient, scarce resources may be allocated by non-market methods. Each method has advantages and disadvantages depending on the context.
Market Price: Allocates resources to those willing to pay.
Command: Allocation by authority or government order.
Majority Rule: Allocation based on majority voting.
Contest: Allocation to winners of a competition.
First-come, First-served: Allocation to those first in line.
Lottery: Allocation by random chance.
Personal Characteristics: Allocation based on specific traits.
Force: Allocation through coercion or legal framework.
Principles of Fairness in Markets
Economists debate the fairness of market outcomes. Two main principles are discussed: utilitarianism and the symmetry principle.
Utilitarianism: Advocates for equality and efficiency, aiming for "the greatest happiness for the greatest number." Income transfers from rich to poor increase total benefit if marginal utility decreases with income. However, utilitarianism ignores the costs of transfers, leading to a tradeoff between efficiency and fairness.
Symmetry Principle: Requires that people in similar situations be treated similarly, emphasizing equality of opportunity rather than income. Fairness is achieved when rules are fair and resources are allocated efficiently.
Nozick's Rules:
The state must protect private property.
Property may be transferred only by voluntary exchange.
Example: Jeremy Bentham and John Stuart Mill advocated for utilitarianism, proposing social benefits and equality. John Rawls emphasized making the poorest as well off as possible, considering the costs of income transfers.
Summary Table: Methods of Allocating Scarce Resources
Method | Description | Best Use Case |
|---|---|---|
Market Price | Allocation to those willing to pay | When resources are divisible and demand is clear |
Command | Allocation by authority | Public goods, defense |
Majority Rule | Allocation by vote | Public decisions affecting many |
Contest | Allocation to winners | When effort is hard to monitor |
First-come, First-served | Allocation to first in line | Sequential, indivisible resources |
Lottery | Random allocation | When users are indistinguishable |
Personal Characteristics | Allocation by traits | Specialized roles |
Force | Allocation by coercion | Legal frameworks, redistribution |
Additional info: The notes expand on the brief points in the original material, providing academic context, definitions, and examples for clarity and completeness.
