 뒤로
뒤로Microeconomics Study Guide: Demand, Supply, Tariffs, Competition, Monopoly, Game Theory, and CPI
스터디 가이드 - 스마트 노트
 자료에 맞춘 맞춤형 노트, 핵심 정의, 예시, 맥락을 확장해 제공합니다.
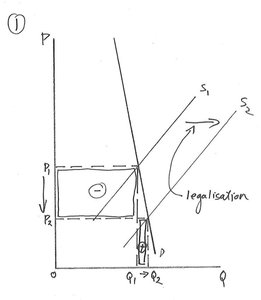
Q1. Suppose that a drug that was illegal has been made legal. It is observed that the total expenditure on this drug falls with legalisation. Draw a demand and supply diagram showing the case where total expenditure clearly and unambiguously falls (with no shift in the demand curve). Are you assuming demand is elastic or inelastic?
Background
Topic: Demand and Supply, Elasticity
This question tests your understanding of how changes in supply (such as legalisation reducing costs) affect equilibrium price, quantity, and total expenditure, especially under different demand elasticities.
Key Terms and Formulas
Elasticity of Demand: Measures how much quantity demanded responds to price changes.
Total Expenditure:
Supply Curve Shift: Outward shift means lower costs, more supplied at every price.
Step-by-Step Guidance
Start by drawing the original supply curve () and demand curve () on a price () vs. quantity () graph.
Show the new supply curve () shifted outward to the right, representing lower costs due to legalisation.
Mark the original equilibrium price () and quantity (), and the new equilibrium price () and quantity ().
Calculate total expenditure before and after legalisation: , .
Consider the elasticity of demand: If demand is inelastic, a decrease in price leads to a smaller increase in quantity, so total expenditure falls.
Try solving on your own before revealing the answer!
Final Answer:
Demand is inelastic. The diagram shows that with an outward shift in supply (legalisation), price falls significantly, but quantity increases only slightly. Total expenditure () falls because the percentage drop in price outweighs the percentage increase in quantity when demand is inelastic.
Q2. Draw a diagram where sellers have to pay a $10 tax to the government on each unit that they sell. Draw your diagram so that most of the burden of the tax falls on buyers. Clearly label the sellers’ price and the buyers’ price. Shade-in the area which represents the reduction in consumer surplus caused by the tax.
Background
Topic: Tax Incidence, Consumer Surplus
This question tests your understanding of how taxes affect market equilibrium, prices paid by buyers and received by sellers, and consumer surplus, especially when demand is steeper than supply.
Key Terms and Formulas
Tax Incidence: The division of the tax burden between buyers and sellers.
Consumer Surplus: The area between the demand curve and the price paid by buyers.
Steep Demand Curve: Indicates inelastic demand, so buyers bear more of the tax burden.
Step-by-Step Guidance
Draw the original supply and demand curves, with demand steeper than supply.
Shift the supply curve upward by the amount of the tax ($10$ per unit).
Identify the new equilibrium: buyers pay a higher price, sellers receive a lower price (difference equals the tax).
Label the buyers’ price () and sellers’ price () on the diagram.
Shade the area representing the reduction in consumer surplus (the area between the old and new price, up to the new quantity).
Try solving on your own before revealing the answer!
Final Answer:
Most of the tax burden falls on buyers because the demand curve is steeper (more inelastic) than the supply curve. The reduction in consumer surplus is the shaded area between the old equilibrium price and the new, higher price paid by buyers, up to the new quantity sold.
Q3. Consider a small country that imports good Z. Some of the total quantity of Z domestically consumed is supplied by domestic producers and the rest is imported. Suppose the government imposes a tariff on each unit of Z that is imported, so the quantity of Z imported is reduced. Draw a demand and supply diagram showing the effect of the tariff. Clearly label the quantity of imports before and after the tariff. Shade in the area that represents the increase in producer surplus caused by the tariff.
Background
Topic: Tariffs, Producer Surplus, International Trade
This question tests your ability to analyze the effects of tariffs on imports, domestic production, and producer surplus using supply and demand diagrams.
Key Terms and Formulas
Tariff: A tax on imported goods, raising their price.
Producer Surplus: The area above the supply curve and below the price received by domestic producers.
Imports:
Step-by-Step Guidance
Draw the supply and demand curves for good Z, showing domestic equilibrium and world price.
Mark the quantity supplied domestically and the total quantity consumed (demanded).
Show the effect of the tariff: the price of imports rises, reducing the quantity imported.
Label the quantity of imports before and after the tariff.
Shade the area representing the increase in producer surplus (the area between the old and new price, up to the new quantity supplied).
Try solving on your own before revealing the answer!
Final Answer:
The tariff increases the price of imported goods, reducing imports and increasing domestic producer surplus. The increase in producer surplus is the shaded area between the old and new price, up to the new quantity supplied by domestic producers.
Q4. Consider a small country that imports good R. Some of the total quantity of R domestically consumed is supplied by domestic producers and the rest is imported. Suppose the government imposes a tariff on each unit of R that is imported, so the quantity of R imported falls to zero. Show the effects of this tariff using a carefully labeled demand and supply diagram. Shade in the areas that represent the total dead-weight loss caused by the tariff.
Background
Topic: Prohibitive Tariffs, Deadweight Loss, International Trade
This question tests your understanding of how a prohibitive tariff (one that eliminates imports) affects market equilibrium and creates deadweight loss.
Key Terms and Formulas
Prohibitive Tariff: A tariff so high that imports fall to zero.
Deadweight Loss: The loss of total surplus due to reduced trade.
Step-by-Step Guidance
Draw the supply and demand curves for good R, showing domestic equilibrium and world price.
Mark the original quantity supplied domestically and the total quantity consumed (demanded).
Show the effect of the prohibitive tariff: imports fall to zero, and the price rises to the domestic equilibrium.
Shade the areas representing the deadweight loss (lost gains from trade).
Try solving on your own before revealing the answer!
Final Answer:
The prohibitive tariff eliminates imports, raising the price to the domestic equilibrium and causing deadweight loss. The deadweight loss is the shaded area between the supply and demand curves, representing lost consumer and producer surplus due to reduced trade.
Q5. Anne consumes two goods called X and Y. Put the quantity of X on the horizontal axis and the quantity of Y on the vertical axis. Consider a decrease in the price of good X. Decompose the change in consumption of good X by Anne into the substitution and income effects.
Background
Topic: Consumer Choice, Substitution and Income Effects
This question tests your understanding of how a price change affects consumption, and how to separate the substitution effect from the income effect using indifference curves and budget lines.
Key Terms and Formulas
Substitution Effect: The change in consumption due to a change in relative prices, holding utility constant.
Income Effect: The change in consumption due to a change in purchasing power.
Indifference Curve: Shows combinations of goods giving the same utility.
Budget Line: Shows combinations of goods affordable given prices and income.
Step-by-Step Guidance
Draw the initial budget line and indifference curve for Anne, with X on the horizontal axis and Y on the vertical axis.
Show the new budget line after the price of X decreases (budget line pivots outward).
Draw an artificial budget line tangent to the old indifference curve but with the slope of the new budget line to isolate the substitution effect.
Identify the movement from the original bundle to the bundle on the artificial budget line (substitution effect), and from the artificial bundle to the new bundle (income effect).
Try solving on your own before revealing the answer!
Final Answer:
The substitution effect is the change in X consumption due to the change in relative prices, moving along the original indifference curve. The income effect is the change in X consumption due to increased purchasing power, moving to a higher indifference curve. For a normal good, both effects increase X consumption.
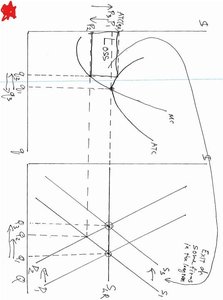
Q6. Consider an industry where there is perfect competition (with the conventional horizontal long-run market supply curve). Initially, all the firms are making zero economic profit, then, there is a fall in demand so that firms all make an economic loss in the short run, but in the long run economic profit returns to zero. Draw this using a two-panel diagram. Draw the representative firm panel on the left-hand-side and the market panel on the right-hand-side. Your diagram must be carefully drawn and properly labeled.
Background
Topic: Perfect Competition, Short-Run and Long-Run Adjustment
This question tests your understanding of how a competitive market responds to a fall in demand, and how firms adjust in the short and long run.
Key Terms and Formulas
Economic Profit:
Short-Run Loss: Firms may earn negative profit if price falls below average cost.
Long-Run Adjustment: Firms exit, supply decreases, price rises, profit returns to zero.
Step-by-Step Guidance
Draw the market panel (right) with a horizontal long-run supply curve and a downward-sloping demand curve.
Show the initial equilibrium with zero economic profit for firms.
Depict a fall in demand: demand curve shifts left, price falls below average cost, firms make losses in the short run.
In the long run, firms exit, supply decreases, price rises, and economic profit returns to zero.
Try solving on your own before revealing the answer!
Final Answer:
After the fall in demand, firms make losses in the short run. In the long run, some firms exit, supply decreases, price rises, and economic profit returns to zero. The two-panel diagram shows these adjustments in both the market and the representative firm panels.
Q7. Consider a profit-maximising monopolist with a standard U-shaped average total cost curve. This monopolist makes a positive economic profit. Draw a well-labeled diagram showing this situation. Shade-in the area which represents the consumer surplus. Please provide a written explanation for your diagram.
Background
Topic: Monopoly, Consumer Surplus, Economic Profit
This question tests your understanding of monopoly pricing, cost curves, and how to identify consumer surplus in a monopoly diagram.
Key Terms and Formulas
Monopoly: A single seller sets price above marginal cost.
Consumer Surplus: The area between the demand curve and the price paid, up to the quantity sold.
Economic Profit:
Step-by-Step Guidance
Draw the monopolist's demand curve, marginal revenue curve, and U-shaped average total cost curve.
Identify the profit-maximising quantity (where ) and the price set by the monopolist.
Shade the area representing consumer surplus (area between demand curve and price, up to the monopoly quantity).
Explain how the monopolist earns positive economic profit (price above average total cost).
Try solving on your own before revealing the answer!
Final Answer:
The monopolist sets price above marginal cost and average total cost, earning positive economic profit. Consumer surplus is the shaded area between the demand curve and the monopoly price, up to the quantity sold.
Q8. Consider the following game between A and B. Player A chooses UP or DOWN; Player B chooses LEFT or RIGHT. Payoffs: (UP, LEFT) = (1, 4), (DOWN, LEFT) = (2, 2), (UP, RIGHT) = (0, 0), (DOWN, RIGHT) = (4, 1). Set the game out in normal (tabular) form with A’s strategies listed vertically and B’s horizontally. For each player, state what strategy will be chosen.
Background
Topic: Game Theory, Normal Form Games, Nash Equilibrium
This question tests your ability to represent a game in normal form and analyze strategic choices using payoff matrices.
Key Terms and Formulas
Normal Form Game: A matrix showing payoffs for each combination of strategies.
Nash Equilibrium: A set of strategies where no player can improve their payoff by unilaterally changing their strategy.
Step-by-Step Guidance
Set up the payoff matrix with A’s strategies (UP, DOWN) as rows and B’s strategies (LEFT, RIGHT) as columns.
Fill in the payoffs for each cell: (1, 4), (2, 2), (0, 0), (4, 1).
Analyze each player’s best response to the other’s strategies.
Identify the Nash equilibrium by checking for mutual best responses.
Try solving on your own before revealing the answer!
Final Answer:
The normal form matrix is: LEFT | RIGHT UP: (1,4) | (0,0) DOWN: (2,2) | (4,1) Player A will choose DOWN, Player B will choose LEFT. This is the Nash equilibrium.
Q9. Arthur moves first and then Terry observes Arthur’s move and then makes his move. Payoffs: (High, High) = (100, 2), (High, Low) = (10, 5), (Low, High) = (200, 1), (Low, Low) = (5, 20). Set this game out in extensive form (a game tree). State what both players will do and explain the reasoning behind your answer.
Background
Topic: Game Theory, Extensive Form Games, Backward Induction
This question tests your ability to represent a sequential game as a game tree and use backward induction to find optimal strategies.
Key Terms and Formulas
Extensive Form Game: A game tree showing the order of moves and payoffs.
Backward Induction: Solving the game by reasoning backward from the end.
Step-by-Step Guidance
Draw the game tree: Arthur moves first (High or Low), then Terry chooses (High or Low) after observing Arthur’s move.
For each of Arthur’s choices, determine Terry’s best response (which gives Terry the highest payoff).
Use backward induction to determine Arthur’s optimal move, knowing Terry’s responses.
Try solving on your own before revealing the answer!
Final Answer:
Terry will choose Low if Arthur chooses High (payoff 5 vs. 2), and High if Arthur chooses Low (payoff 1 vs. 20). Arthur anticipates this and chooses Low, so the outcome is (Low, Low) with payoffs (5, 20).
Q10. State and explain two reasons why a consumer price index (CPI) may get the change in the cost of living wrong for a consumer even if the basket of goods is initially well chosen.
Background
Topic: Consumer Price Index, Cost of Living, Measurement Biases
This question tests your understanding of the limitations of CPI as a measure of cost of living, focusing on quality adjustment bias and substitution bias.
Key Terms and Formulas
Quality Adjustment Bias: CPI may not fully account for improvements in product quality.
Substitution Bias: CPI assumes a fixed basket, ignoring consumers’ ability to substitute cheaper goods.
Step-by-Step Guidance
Explain quality adjustment bias: CPI may overstate inflation if it does not adjust for improved quality of goods.
Explain substitution bias: CPI may overstate cost of living increases by not accounting for consumers switching to cheaper alternatives.
Try solving on your own before revealing the answer!
Final Answer:
1) Quality adjustment bias: CPI may not fully reflect improvements in product quality, overstating inflation. 2) Substitution bias: CPI assumes a fixed basket, ignoring consumers’ ability to substitute cheaper goods, also overstating cost of living increases.
