 뒤로
뒤로Monopoly and Monopsony: Market Power in Microeconomics
스터디 가이드 - 스마트 노트
 자료에 맞춘 맞춤형 노트, 핵심 정의, 예시, 맥락을 확장해 제공합니다.
Monopoly and Monopsony
Introduction to Monopoly and Monopsony
Monopoly and monopsony are two important forms of market power in microeconomics. A monopoly is a market structure with a single seller and many buyers, while a monopsony is a market with many sellers but only one buyer. Both structures allow the dominant party to influence prices, but from opposite sides of the market.
Monopoly Power: The ability of a seller to affect the price of a good.
Monopsony Power: The ability of a buyer to affect the price of a good.
Monopoly
Monopolist's Output and Pricing Decisions
A monopolist does not face competition and can set the price or quantity of its product. To maximize profit, the monopolist must consider both its cost structure and the market demand curve.
Average Revenue (AR): The price received per unit sold; it is the market demand curve for the monopolist.
Marginal Revenue (MR): The change in total revenue from selling one more unit.
Profit Maximization: The monopolist chooses output where MR = MC (marginal cost).
Example: If the demand curve is P = 6 – Q, then total revenue (TR) is 6Q – Q2, and MR = 6 – 2Q.
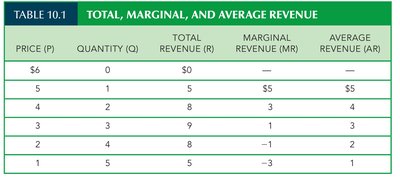
Table Purpose: This table illustrates how total revenue, marginal revenue, and average revenue change as quantity increases for a linear demand curve. It helps visualize the relationship between price, output, and revenue for a monopolist.
Graphical Analysis of Monopoly
Monopoly profit maximization can be illustrated graphically. The intersection of the MR and MC curves determines the profit-maximizing quantity, and the corresponding price is found on the demand (AR) curve.
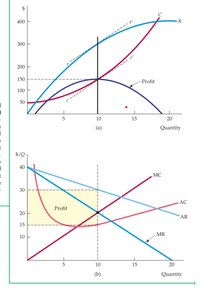
Graph Purpose: The upper graph shows total revenue, total cost, and profit. The lower graph shows the relationship between AR, MR, MC, and AC, highlighting the profit-maximizing output and price.
Marginal Revenue: Formula and Interpretation
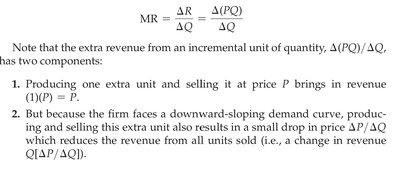
The marginal revenue for a monopolist is derived as follows:
Formula:
Components:
Revenue from selling one more unit at price P.
Loss from lowering the price on all previous units due to the downward-sloping demand curve.
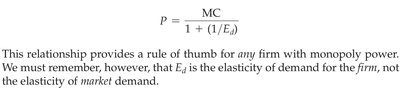
Rule of Thumb for Monopoly Pricing
The monopolist's optimal price can be related to the elasticity of demand:
Key Equation:
Where:
P = Price
MC = Marginal Cost
Ed = Price elasticity of demand
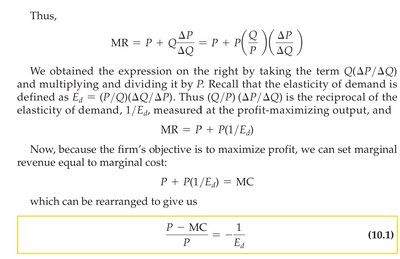
This equation shows that the markup of price over marginal cost depends inversely on the elasticity of demand.
Alternative Form:
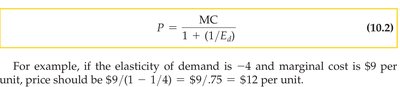
Example: If Ed = -4 and MC = $9, then P = $12.
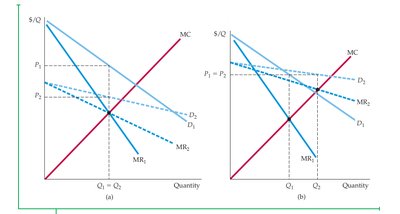
Shifts in Demand and Monopoly Pricing
Changes in demand affect the monopolist's optimal price and quantity. The effect depends on the elasticity of demand and the position of the marginal cost curve.
Effect of Taxes on Monopoly
An excise tax increases the monopolist's marginal cost by the amount of the tax. The new profit-maximizing condition is MR = MC + t, where t is the per-unit tax.
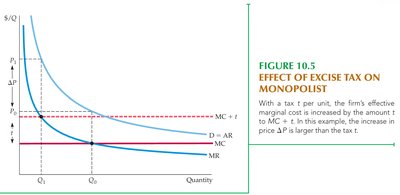
Key Point: The increase in price due to the tax can be larger than the tax itself, depending on the elasticity of demand and supply.
Monopoly Power
Measuring Monopoly Power: The Lerner Index
The Lerner Index measures the degree of monopoly power as the markup of price over marginal cost, relative to price:
Formula:
Alternative (using elasticity):
The index ranges from 0 (perfect competition) to 1 (maximum monopoly power). Higher values indicate greater market power.
Sources of Monopoly Power
Monopoly power depends on:
Elasticity of Market Demand: The less elastic the demand, the greater the monopoly power.
Number of Firms: Fewer firms mean more monopoly power for each.
Interaction Among Firms: Collusion increases monopoly power; aggressive competition reduces it.
Social Costs of Monopoly Power
Welfare Effects and Deadweight Loss
Monopoly power typically reduces consumer surplus and creates deadweight loss, making society worse off compared to perfect competition.
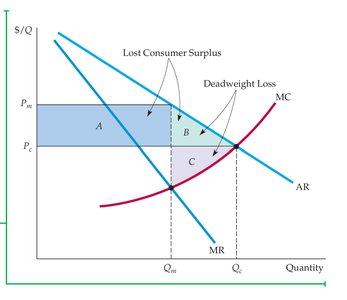
Key Points:
Lost Consumer Surplus: Consumers pay higher prices and buy less.
Deadweight Loss: Total surplus is reduced due to inefficiently low output.
Rent Seeking
Rent seeking refers to socially unproductive activities aimed at acquiring or maintaining monopoly power, such as lobbying for regulations that restrict competition.
Price Regulation
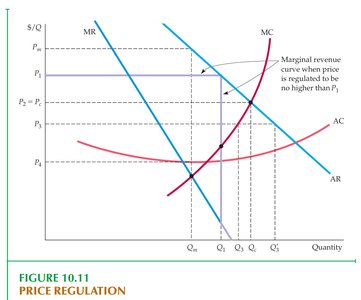
Governments may regulate monopoly prices to reduce deadweight loss. Unlike in competitive markets, price regulation can improve welfare under monopoly by moving price closer to marginal cost.
Natural Monopoly
A natural monopoly occurs when a single firm can supply the entire market at a lower cost than multiple firms, typically due to economies of scale. Examples include utilities like water and electricity.
Monopsony
Monopsony and Oligopsony
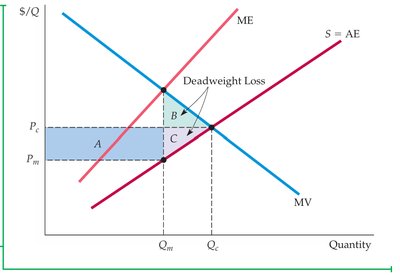
A monopsony is a market with a single buyer, while an oligopsony has a few buyers. Monopsony power allows the buyer to pay less than the competitive price.
Marginal Value (MV): The additional benefit from purchasing one more unit; the buyer's demand curve.
Marginal Expenditure (ME): The additional cost of buying one more unit.
Average Expenditure (AE): The price paid per unit.
Monopsony Power and Its Sources
The degree of monopsony power depends on:
Elasticity of Market Supply: Less elastic supply increases monopsony power.
Number of Buyers: Fewer buyers increase monopsony power.
Interaction Among Buyers: Collusion increases monopsony power; competition reduces it.
Social Costs of Monopsony Power
Monopsony power leads to lower prices for sellers, reduced output, and deadweight loss, similar to monopoly but from the buyer's side.
Bilateral Monopoly
A bilateral monopoly occurs when there is one seller (monopoly) and one buyer (monopsony). The outcome depends on bargaining between the two parties and is rare in practice.
Limiting Market Power: Antitrust Laws
Purpose and Examples
Antitrust laws are designed to promote competition and prevent the abuse of market power. They prohibit practices such as collusion, predatory pricing, and other actions that restrain competition.
Parallel Conduct: Implicit collusion where firms follow each other's pricing or output decisions.
Predatory Pricing: Setting prices low to drive competitors out, then raising prices later.
Antitrust enforcement is crucial for economic efficiency, innovation, and consumer welfare.
