 뒤로
뒤로Oligopoly and Monopolistic Competition: Market Structures and Models
스터디 가이드 - 스마트 노트
 자료에 맞춘 맞춤형 노트, 핵심 정의, 예시, 맥락을 확장해 제공합니다.
Oligopoly and Monopolistic Competition
Market Structures
Market structures describe the organization and characteristics of markets, influencing how firms behave and compete. The main types are monopoly, oligopoly, monopolistic competition, and perfect competition. Each structure differs in the number of firms, entry conditions, product differentiation, and market power.
Monopoly: A single firm dominates the market, setting prices and output.
Oligopoly: A few firms control the market, often facing barriers to entry and strategic interdependence.
Monopolistic Competition: Many firms compete with differentiated products and free entry.
Perfect Competition: Many firms sell identical products with no barriers to entry.
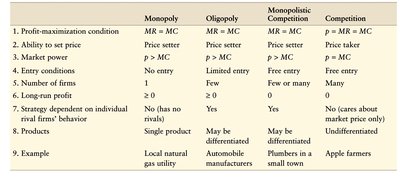
Key properties of each structure are summarized below:
Monopoly | Oligopoly | Monopolistic Competition | Competition | |
|---|---|---|---|---|
Profit-maximization condition | MR = MC | MR = MC | MR = MC | p = MR = MC |
Ability to set price | Price setter | Price setter | Price setter | Price taker |
Market power | p > MC | p > MC | p > MC | p = MC |
Entry conditions | No entry | Limited entry | Free entry | Free entry |
Number of firms | 1 | Few | Few or many | Many |
Long-run profit | > 0 | > 0 | 0 | 0 |
Strategy dependent on rivals | No (has no rivals) | Yes | Yes | No (cares about market price only) |
Products | Single product | May be differentiated | May be differentiated | Undifferentiated |
Example | Local natural gas utility | Automobile manufacturers | Plumbers in a small town | Apple farmers |
Oligopoly
An oligopoly is a market structure with a small number of firms and substantial barriers to entry. Firms are interdependent, meaning each firm's decisions affect the others. This interdependence complicates profit-maximization, as firms must anticipate rivals' responses.
Cartel: A group of firms that explicitly agree to coordinate their activities, often to restrict output and raise prices.
Monopolistic Competition: Firms have market power but free entry ensures zero long-run profits.
Cartels
Cartels form when firms believe they can increase profits by coordinating actions, typically by reducing output to raise prices. However, cartels are unstable due to incentives to cheat and legal restrictions.
Why Cartels Form: To increase collective profits by restricting output.
Why Cartels Fail: Non-members may supply the market, and members have incentives to cheat.
Maintaining Cartels: Requires detection and punishment of cheating, and secrecy from authorities.
Example: OPEC is a well-known international cartel.
Noncooperative Oligopoly
In a noncooperative oligopoly, firms compete without explicit agreements. The main models are Cournot, Stackelberg, and Bertrand. These models often assume identical firms and products, and focus on duopoly (two firms).
Nash Equilibrium: A set of strategies where no firm can improve profit by changing its own strategy, given the strategies of others.
Cournot Model
Basic Cournot Model
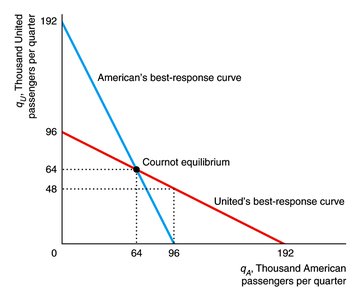
The Cournot model analyzes how firms choose output quantities simultaneously. Each firm selects its output, considering the output of its rival, to maximize profit. The equilibrium is where each firm's output is the best response to the other's.
Assumptions: Two firms, identical costs, identical products, simultaneous quantity setting.
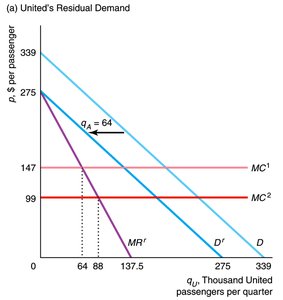
Residual Demand: The demand remaining for one firm after accounting for the rival's output.
Example: Airlines Market
Market demand:
Marginal cost (MC) for each firm: $147$
Residual demand for American:
Rewriting:
Marginal revenue:
Best response:
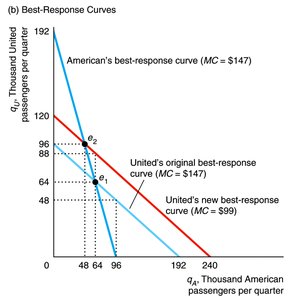
American's best response:
United's best response:
Solving: , , ,
Cournot Equilibrium and Number of Firms
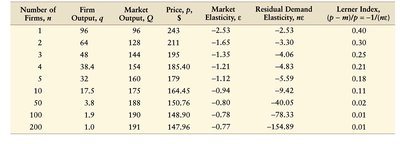
As the number of firms increases, the market outcome approaches perfect competition. The profit-maximizing condition for a Cournot firm is:
As increases, the residual demand elasticity increases, and price approaches marginal cost.
The Lerner Index measures market power:
Number of Firms, n | Firm Output, qi | Market Output, Q | Price, pn | Market Elasticity, ε | Residual Demand Elasticity, nε | Lerner Index |
|---|---|---|---|---|---|---|
1 | 96 | 96 | 243 | -2.53 | -2.53 | 0.40 |
2 | 64 | 128 | 211 | -1.65 | -3.30 | 0.30 |
3 | 48 | 144 | 195 | -1.21 | -3.63 | 0.25 |
4 | 38.4 | 154 | 185.40 | -1.11 | -4.43 | 0.22 |
5 | 32 | 160 | 179 | -1.12 | -5.59 | 0.18 |
10 | 17.5 | 175 | 164.45 | -0.94 | -9.45 | 0.11 |
50 | 3.8 | 188 | 150.95 | -0.80 | -40.05 | 0.02 |
100 | 1.9 | 190 | 149.48 | -0.78 | -77.81 | 0.01 |
200 | 1.0 | 191 | 147.96 | -0.77 | -154.89 | 0.01 |
Cournot Model with Non-identical Firms
When firms have different costs, the lower-cost firm produces more. The best-response functions shift, and the market price falls, benefiting consumers and the more efficient firm.
Example: If United's marginal cost falls, its output increases, American's output decreases, and market price drops.
Bertrand Model
Bertrand Competition
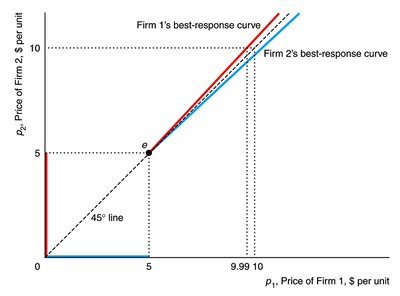
In the Bertrand model, firms compete by setting prices rather than quantities. With identical products and costs, the equilibrium price equals marginal cost, as each firm undercuts the other until no profit remains.
Bertrand Equilibrium: A set of prices where no firm can increase profit by changing its price, given the prices of rivals.
With differentiated products, prices may remain above marginal cost.
Monopolistic Competition
Characteristics and Equilibrium
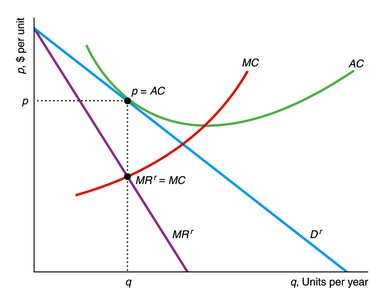
Monopolistic competition features many firms, differentiated products, and free entry. Firms face downward-sloping demand curves and set prices above marginal cost. In the long run, entry and exit drive profits to zero, with price equaling average cost.
Equilibrium conditions: and
If , firms enter; if , firms exit until zero profit.
Minimum Efficient Scale and Number of Firms
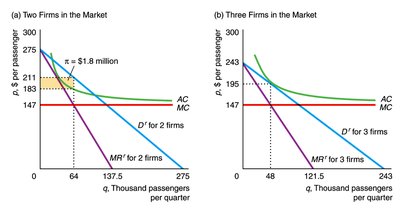
The minimum efficient scale is the smallest output at which average cost is minimized. The number of firms in equilibrium depends on fixed costs: higher fixed costs mean fewer firms can profitably enter, even with free entry.
Example: High fixed costs in pharmaceuticals limit the number of firms.
Additional info: The notes above expand on the original slides by providing definitions, formulas, and examples for each market structure and model, ensuring a comprehensive and self-contained study guide for microeconomics students.
