 뒤로
뒤로Production, Marginal Products, and Cost Curves in Microeconomics
스터디 가이드 - 스마트 노트
 자료에 맞춘 맞춤형 노트, 핵심 정의, 예시, 맥락을 확장해 제공합니다.
Production with Diminishing Marginal Products
Introduction to Marginal Cost and Productivity
In microeconomics, understanding how production costs change with output is essential. Marginal cost can increase for two main reasons: (1) extensive changes, where different individuals with varying costs begin producing, and (2) intensive changes, where an individual’s productivity decreases as more output is produced due to diminishing returns.
Extensive changes: Costs rise as higher-cost producers enter the market.
Intensive changes: Costs rise for an individual producer as input productivity falls with increased output.
The Production Function
Definition and Inputs
The production function describes the maximum output achievable from given quantities of inputs. Common inputs include land, labor, capital, and raw materials. For simplicity, we often focus on two inputs:
Labor (L): Human effort used in production.
Capital (K): Long-lived assets such as machinery and buildings.
The general form of the production function is:
where is the quantity of output.
Returns to Scale
Constant Returns to Scale (CRS): Doubling all inputs doubles output.
Increasing Returns to Scale (IRS): Doubling all inputs more than doubles output.
Decreasing Returns to Scale (DRS): Doubling all inputs less than doubles output.
Additional info: Returns to scale help firms decide on the optimal size of operation.
Short Run vs. Long Run
Short Run: At least one input (usually capital) is fixed.
Long Run: All inputs can be varied.
Short-Run Production Relationships: TP, MP, and AP
Key Concepts
Total Product (TP): Total output produced with given inputs.
Marginal Product of Labor (MPL): The additional output from one more unit of labor.
Average Product of Labor (APL): Output per unit of labor.
Diminishing Marginal Products
As more units of a variable input (like labor) are added to fixed inputs (like capital), the additional output from each new unit eventually decreases. This is known as the Law of Diminishing Marginal Returns.
Stage I: Output increases at an increasing rate.
Stage II: Output increases at a decreasing rate (diminishing returns).
Stage III: Output decreases.
Additional info: Stage II is where most firms operate, as it is the range of efficient production.
Relationship Between MP and AP
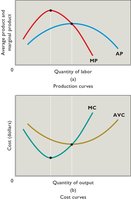
When MP > AP, AP is rising.
When MP < AP, AP is falling.
When MP = AP, AP is at its maximum.
Marginal Product and Demand for Labor
Value of the Marginal Product (VMP)
The value of the marginal product is the additional revenue generated by employing one more unit of input:
where is the price of output.
The firm hires labor up to the point where the wage () equals the value of the marginal product:
Labor Demand Curve: The downward-sloping portion of the VMP curve represents the firm's demand for labor.
Example: Hiring Decision
Given a table of marginal products and wage/output price, the firm should hire workers up to the point where .
Input Demand in the Long Run
Profit Maximization with Multiple Inputs
In the long run, firms can adjust all inputs. The profit-maximizing condition is to equate the marginal product per dollar spent across all inputs:
where is the wage rate and is the rental rate of capital.
This ensures that the last dollar spent on each input yields the same additional output.
Additional info: This is analogous to consumer utility maximization, where marginal utility per dollar is equalized across goods.
Marginal Costs and Average Costs in the Short Run
Cost Definitions
Fixed Cost (FC): Costs that do not vary with output.
Variable Cost (VC): Costs that change with output.
Total Cost (TC):
Average Fixed Cost (AFC):
Average Variable Cost (AVC):
Average Total Cost (AC):
Marginal Cost (MC):
Relationship Between Marginal Product and Marginal Cost
Marginal product and marginal cost are inversely related. As marginal product decreases (due to diminishing returns), marginal cost increases.
Relationship Between MC and AVC (or AC)
When MC < AVC, AVC is decreasing.
When MC > AVC, AVC is increasing.
When MC = AVC, AVC is minimized.
Shifts in Cost Curves
Per-unit tax: Shifts MC and AVC upward.
Lump-sum tax: Shifts AFC and AC upward, but not MC or AVC.
Increased labor productivity: Shifts MC and AVC downward.
Increased wages: Shifts MC and AVC upward.
