 뒤로
뒤로Supply, Demand, and Competitive Equilibrium: Foundations of Microeconomics
스터디 가이드 - 스마트 노트
 자료에 맞춘 맞춤형 노트, 핵심 정의, 예시, 맥락을 확장해 제공합니다.
Supply, Demand, and the Benchmark Competitive Equilibrium
Introduction to Competitive Markets
Competitive markets are fundamental to microeconomics, describing environments where many buyers and sellers interact to determine prices and quantities of goods and services. In a perfectly competitive market, all sellers offer identical products, and no individual buyer or seller can influence the market price.
Perfect Competition: Many buyers and sellers, identical goods, and no single agent can affect the price.
Market Price: The price at which transactions occur between buyers and sellers.

Example: The market for eggs, where brown eggs often cost more than white eggs due to differences in production costs and consumer perceptions.
Markets and Market Structures
A market consists of economic agents trading goods or services under specific rules and arrangements. Examples include agricultural markets, stock exchanges, and car dealerships.
Market Structure: The organization and characteristics of a market, such as the number of participants and the nature of the product.

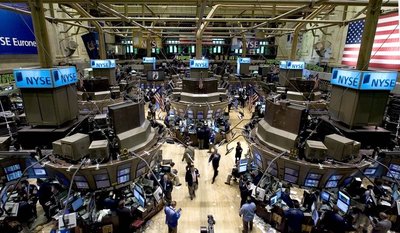

Demand: Buyer Behavior
Quantity Demanded, Demand Schedule, and Demand Curve
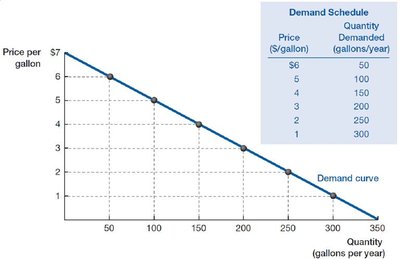
The quantity demanded is the amount of a good buyers are willing to purchase at a given price. The demand schedule is a table showing quantities demanded at various prices, while the demand curve graphically represents this relationship.
Law of Demand: As price falls, quantity demanded generally rises, ceteris paribus (all else equal).
Market Demand and Aggregation
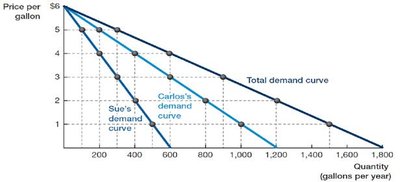
The market demand curve is the horizontal sum of all individual demand curves in the market. It shows the total quantity demanded at each price.
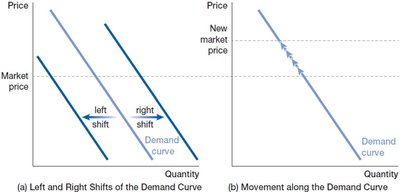
Shifts in Demand vs. Movements Along the Curve
A movement along the demand curve is caused by a change in the good's own price. A shift of the demand curve occurs when factors other than the good's price change, such as:
Tastes and preferences
Income and wealth (normal vs. inferior goods)
Prices of related goods (substitutes and complements)
Number and scale of buyers
Expectations about the future
Supply: Seller Behavior
Quantity Supplied, Supply Schedule, and Supply Curve
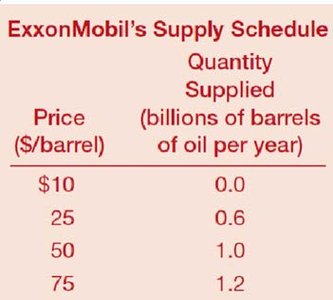
The quantity supplied is the amount of a good sellers are willing to sell at a given price. The law of supply states that quantity supplied generally increases as price rises, ceteris paribus. The supply schedule and supply curve show this relationship.
Market Supply and Aggregation
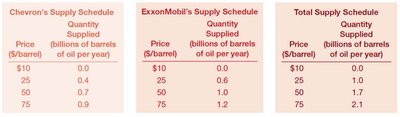
The market supply curve is the horizontal sum of all individual supply curves. It shows the total quantity supplied at each price.
Shifts in Supply vs. Movements Along the Curve
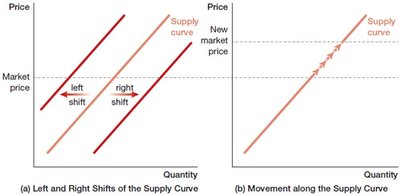
A movement along the supply curve is caused by a change in the good's own price. A shift of the supply curve occurs when factors other than the good's price change, such as:
Input prices
Technology
Number and scale of sellers
Expectations about the future
Market Equilibrium
Competitive Equilibrium
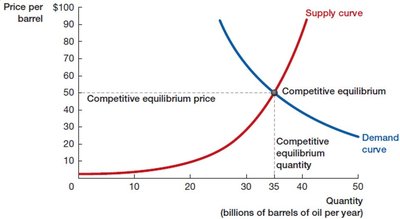
The competitive equilibrium is the price and quantity at which the quantity demanded equals the quantity supplied. At this point, the market clears, and there is no tendency for price to change.
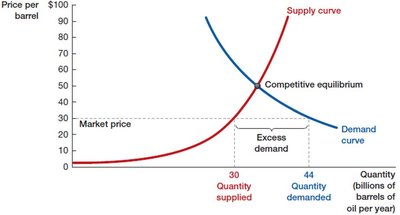
Excess Demand (Shortage): Occurs when quantity demanded exceeds quantity supplied at a given price.
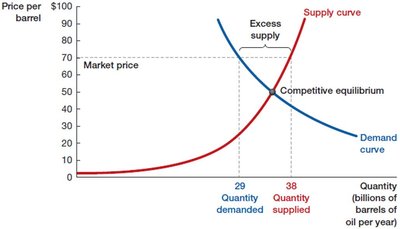
Excess Supply (Surplus): Occurs when quantity supplied exceeds quantity demanded at a given price.
Shifts in Supply and Demand: Effects on Equilibrium
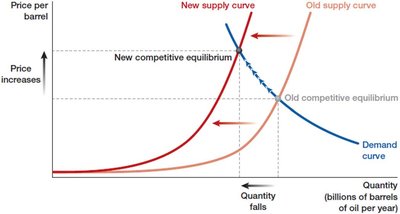
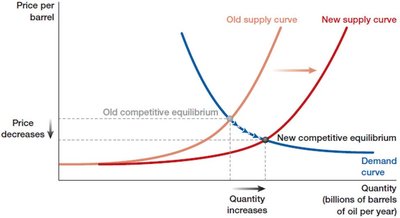
Changes in supply or demand shift the respective curves, leading to new equilibrium prices and quantities. For example, a leftward shift in supply (e.g., due to higher input costs) raises equilibrium price and lowers equilibrium quantity, while a rightward shift in supply lowers price and increases quantity.
Applications: Case Studies in Supply and Demand
Why Do Brown Eggs Cost More Than White Eggs?
Brown eggs typically cost more because the hens that lay them are larger and require more feed, increasing production costs. The price difference is not due to nutritional value but to supply-side factors and, sometimes, demand-side perceptions.
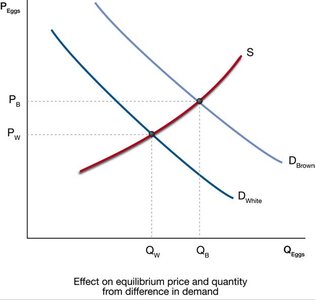
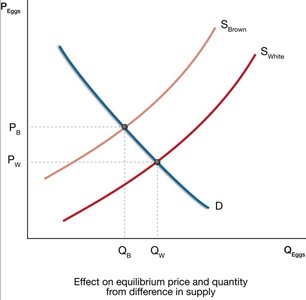
Supply Side: Higher production costs shift the supply curve for brown eggs leftward, raising their price.
Demand Side: If consumers perceive brown eggs as healthier, demand may also be higher, shifting the demand curve rightward.
Why Do Rose Prices Increase Before Valentine’s Day?
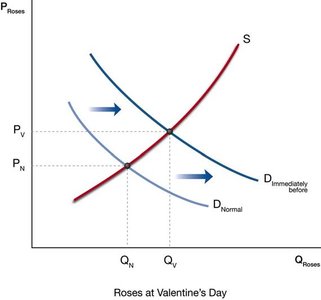
Rose prices rise before Valentine’s Day due to a rightward shift in the demand curve as more consumers wish to purchase roses for the holiday. The supply curve may remain unchanged in the short run, leading to higher equilibrium prices.

Mathematical Representation of Supply and Demand
Linear Demand and Supply Functions
Demand and supply can be represented by linear equations. For example:
Demand:
Supply:
Equilibrium is found where :
Example: If demand triples, the new demand function is .
Practice Problems
Draw demand and supply curves for various scenarios (e.g., perfectly inelastic demand for appendectomies, step demand for a single buyer, negative equilibrium price in special markets).
Analyze the effects of simultaneous shifts in demand and supply (e.g., umbrellas during a wet spring and supply chain disruptions).
Summary Table: Factors Shifting Demand and Supply
Factor | Shifts Demand? | Shifts Supply? |
|---|---|---|
Price of the good itself | No (movement along curve) | No (movement along curve) |
Income/Wealth | Yes | No |
Prices of related goods | Yes | No |
Tastes/Preferences | Yes | No |
Number of buyers/sellers | Yes | Yes |
Input prices | No | Yes |
Technology | No | Yes |
Expectations about the future | Yes | Yes |
Additional info: These notes provide a comprehensive overview of the core concepts of supply, demand, and equilibrium in microeconomics, suitable for introductory college-level study and exam preparation.
