 뒤로
뒤로The Competitive Firm and Market Supply Curves: Principles and Applications
스터디 가이드 - 스마트 노트
 자료에 맞춘 맞춤형 노트, 핵심 정의, 예시, 맥락을 확장해 제공합니다.
The Competitive Firm and Market Supply Curves
1. The Competitive Firm
The competitive firm is a foundational concept in microeconomics, describing a firm that operates in a perfectly competitive market. Such a firm is a price taker, meaning it accepts the market price as given and cannot influence it through its own actions.
Price Taking: Each firm takes the market price as given and does not consider the actions of rival firms.
No Strategic Behavior: Firms do not engage in strategic interactions with competitors.
Market Price Determination: The price is set by the overall market, not by individual firms.
Example: Wheat farmers or small firms in highly competitive industries.
Demand Curve Faced by a Competitive Firm: The demand curve is perfectly elastic at the market price, meaning the firm can sell any quantity at that price but none at a higher price.
Total Revenue (TR):
Marginal Revenue (MR):
Average Revenue (AR):
For a competitive firm:
2. Output Determination of a Competitive Firm
Firms aim to maximize profit, which is the difference between total revenue and total cost.
Profit:
Profit Maximizing Condition: Profits are maximized when . For a competitive firm, , so the condition becomes .
Profit vs. Rent:
Profit:
Rent: (avoidable opportunity cost)
Rent is also called Producer Surplus, representing gains from trade on the production side.
Graphical Methods for TVC, Rent, and Profit:
Method 1: The area under the MC curve represents TVC.
Method 2: The rectangle area .
Shutdown and Breakeven Points:
As long as , the firm will produce in the short run (). The shutdown point is the minimum of the AVC curve.
When , the firm does not make a loss (). The breakeven point is the minimum of the AC curve.
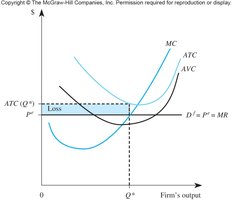
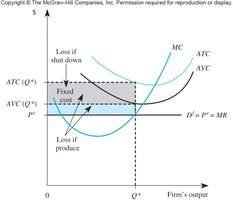
Firm Supply Curve: The individual supply curve is the MC curve above the shutdown point (minimum AVC), and is always upward-sloping.
3. Equilibrium Profit
Economic profit is the difference between total revenue and total cost, including both explicit and implicit costs.
Economic Profit:
Total Cost (TC):
Example: Jake's "Yumburger" stall illustrates the calculation of explicit costs, accounting profit, economic costs, and economic profit.
Economic Profit in Equilibrium: In the long run, competitive firms earn zero economic profit due to entry and exit of firms, or adjustment of opportunity costs for special inputs. In equilibrium, .
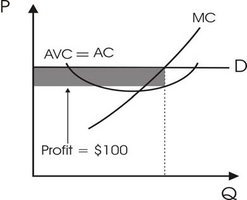
Rent in Equilibrium: Firms can still earn rent (producer surplus) in equilibrium, which is the payment to the fixed factor of production.
4. Market Supply Curve
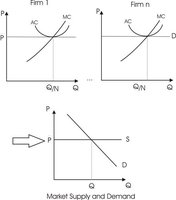
The market supply curve is the horizontal sum of individual firms' supply curves. Its shape depends on the structure and distribution of firms in the market.
Identical Firms: If all firms are identical (no sunk costs, same AC and MC), the market supply curve is flat at , and total quantity supplied is .
Different Firms: If firms have different fixed/sunk costs, those with the lowest AVC produce first as price rises, and others enter as price increases. The market supply curve is upward-sloping.
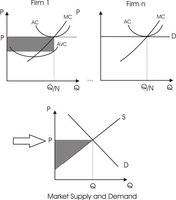
In equilibrium (zero profit):
The marginal firm earns zero profit and zero rent.
Intra-marginal firms earn zero profit but positive rent.
Summary Table: Key Cost and Profit Concepts
Concept | Formula | Interpretation |
|---|---|---|
Total Revenue (TR) | Total income from sales | |
Marginal Revenue (MR) | Change in revenue from selling one more unit | |
Average Revenue (AR) | Revenue per unit sold | |
Profit | Net gain after all costs | |
Rent (Producer Surplus) | Gains from trade for producers | |
Shutdown Point | Lowest price at which firm produces in short run | |
Breakeven Point | Price at which profit is zero |
Additional info:
Producer surplus is a key measure of welfare for firms in competitive markets.
Entry and exit of firms ensure that, in the long run, only normal profit (zero economic profit) is earned in perfectly competitive markets.
