 뒤로
뒤로The Economic Analysis of Cost in Microeconomics
스터디 가이드 - 스마트 노트
 자료에 맞춘 맞춤형 노트, 핵심 정의, 예시, 맥락을 확장해 제공합니다.
The Economic Analysis of Cost
Introduction to Cost Concepts
The economic analysis of cost is fundamental in microeconomics, especially for understanding firm behavior and market outcomes. Costs are classified in various ways to help analyze production decisions and the efficiency of resource allocation.
Economic Cost: The total opportunity cost of all resources used in production, including both explicit and implicit costs.
Accounting Cost: The actual monetary expenditure incurred by a firm, typically excluding implicit costs.
Explicit Costs: Direct, out-of-pocket payments for inputs to production (e.g., wages, rent, materials).
Implicit Costs: The opportunity costs of using resources owned by the firm (e.g., owner’s time, capital).
Short Run vs. Long Run: In the short run, some factors of production are fixed, while in the long run, all factors can be varied.
Example: If a business owner uses their own building for a store, the implicit cost is the rent they forgo by not leasing it to someone else.
Types of Costs in the Short Run
In the short run, costs are divided into fixed and variable components. Understanding these distinctions is crucial for analyzing firm supply decisions and cost curves.
Total Fixed Cost (TFC): Costs that do not change with the level of output (e.g., rent, salaries of permanent staff).
Total Variable Cost (TVC): Costs that vary directly with the level of output (e.g., raw materials, hourly wages).
Total Cost (TC): The sum of total fixed and total variable costs.
Average Fixed Cost (AFC): Fixed cost per unit of output.
Average Variable Cost (AVC): Variable cost per unit of output.
Average Total Cost (ATC): Total cost per unit of output.
Marginal Cost (MC): The additional cost of producing one more unit of output.
Example: If producing 10 units costs $100 and producing 11 units costs $108, the marginal cost of the 11th unit is $8.
Graphical Representation of Cost Curves
Cost curves visually represent the relationships between output and various cost measures. These curves are essential for understanding firm behavior in different market structures.
AFC Curve: Always declines as output increases, since fixed costs are spread over more units.
AVC and ATC Curves: Typically U-shaped due to initially decreasing, then increasing marginal costs.
MC Curve: Intersects both AVC and ATC at their minimum points.
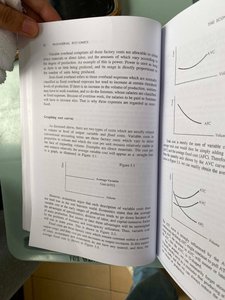
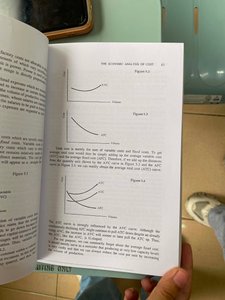
Additional info: The U-shape of the AVC and ATC curves is due to the law of diminishing marginal returns, which states that adding more of a variable input to fixed inputs will eventually yield lower additional output.
Long Run Costs and Economies of Scale
In the long run, all inputs are variable, and firms can adjust their scale of operation. The long-run average cost (LRAC) curve shows the lowest possible cost of producing each output level when all inputs can be varied.
Economies of Scale: Occur when increasing production lowers the average cost per unit due to factors like specialization and bulk buying.
Diseconomies of Scale: Occur when increasing production raises the average cost per unit, often due to management inefficiencies.
Constant Returns to Scale: When increasing production does not affect average cost per unit.
Example: A factory doubling its inputs and output, but seeing its average cost fall, is experiencing economies of scale.
Cost Estimation and Empirical Cost Functions
Empirical cost functions are estimated using real-world data to analyze the relationship between output and cost. These functions help firms make production and pricing decisions.
Statistical Estimation: Regression analysis is often used to estimate cost functions from observed data.
Short Run vs. Long Run Estimation: Short-run cost functions hold some inputs fixed, while long-run functions allow all inputs to vary.
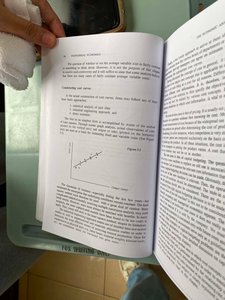
Additional info: Empirical cost analysis is important for managerial decision-making, as it provides evidence-based insights into cost behavior.
Applications and Limitations of Cost Analysis
Cost analysis is used for pricing, output decisions, and evaluating the efficiency of resource allocation. However, it has limitations due to data availability, measurement issues, and the complexity of real-world production processes.
Application: Firms use cost analysis to determine the optimal level of output and pricing strategies.
Limitation: Real-world costs may not always fit theoretical models due to unpredictable factors and imperfect information.
Example: A firm may estimate its cost curves to set prices that maximize profit, but unexpected changes in input prices can alter actual costs.
Summary Table: Key Cost Concepts
Cost Concept | Definition | Formula |
|---|---|---|
Total Cost (TC) | Sum of all costs (fixed + variable) | |
Average Fixed Cost (AFC) | Fixed cost per unit of output | |
Average Variable Cost (AVC) | Variable cost per unit of output | |
Average Total Cost (ATC) | Total cost per unit of output | |
Marginal Cost (MC) | Change in total cost from producing one more unit |
