 뒤로
뒤로Chapter 13: Mass Spectrometry, Infrared Spectroscopy, and Ultraviolet/Visible Spectroscopy – Study Notes
스터디 가이드 - 스마트 노트
 자료에 맞춘 맞춤형 노트, 핵심 정의, 예시, 맥락을 확장해 제공합니다.
Instrumental Techniques in Organic Chemistry
Overview of Structure Determination
Organic chemists use several instrumental techniques to determine the structure and properties of organic compounds. These methods provide complementary information about molecular mass, functional groups, and electronic structure.
Mass Spectrometry (MS): Determines molecular mass and formula.
Infrared (IR) Spectroscopy: Identifies functional groups based on bond vibrations.
Ultraviolet/Visible (UV/Vis) Spectroscopy: Provides information about conjugated systems.
Nuclear Magnetic Resonance (NMR) Spectroscopy: Reveals carbon–hydrogen and carbon–carbon framework.
Mass Spectrometry
Principle and Process
Mass spectrometry is a technique used to determine the molecular mass and structure of organic compounds. The sample is ionized, and the resulting ions are separated based on their mass-to-charge ratio (m/z).
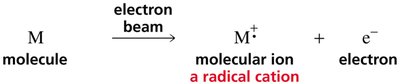
Ionization: An electron beam removes an electron from the molecule, forming a radical cation (molecular ion).
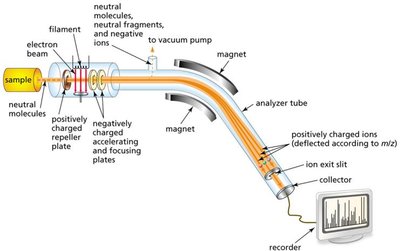
Detection: Only positively charged ions are detected; neutral fragments and negative ions are not recorded.
Types of Mass Spectrometers
Magnetic Sector: Ions are deflected by a magnet according to their m/z.
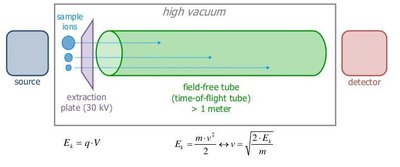
Time-of-Flight (TOF): Ions travel through a field-free tube; lighter ions reach the detector faster.
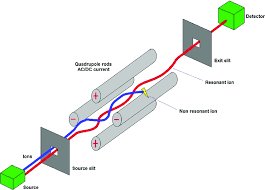
Quadrupole: Uses alternating electric fields to filter ions by m/z.
Interpreting Mass Spectra
The mass spectrum displays peaks corresponding to fragments of the molecule. The base peak is the most abundant fragment, and the molecular ion peak gives the molecular mass.
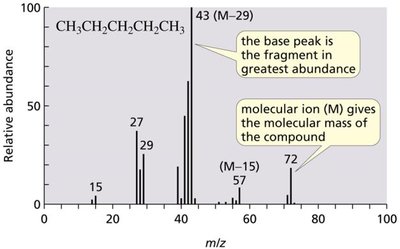
m/z: Mass-to-charge ratio; for most ions, z = 1.
Molecular Ion (M): Peak corresponding to the intact molecule.
Fragmentation: The molecule breaks into smaller ions; more stable fragments are more abundant.

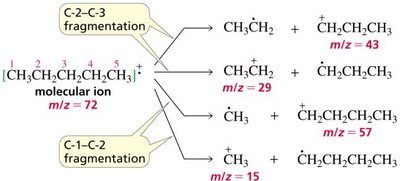
Fragmentation Patterns
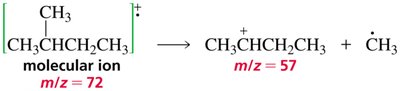
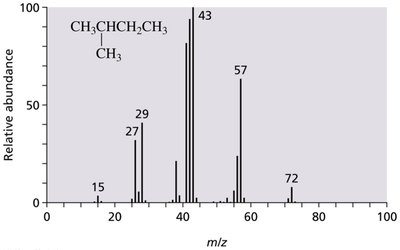
Stability of Fragments: Secondary carbocations are more stable than primary, leading to more abundant peaks.
Loss of Hydrogen: Peaks two units below the carbocation are common.

Isotopic Patterns and High Resolution MS
Natural isotopic abundances cause additional peaks (M+1, M+2). High resolution MS distinguishes compounds with the same nominal mass.
M+1 Peak: Due to 13C isotope.
M+2 Peak: Due to 18O, 37Cl, or 81Br isotopes.
Chlorine: M+2 peak is one-third the height of M.
Bromine: M and M+2 peaks are about equal.
Fragmentation of Alkyl Halides, Ethers, Alcohols, and Ketones
Heterolytic Cleavage: Bonds between atoms of different electronegativities break heterolytically.
Homolytic Cleavage (Alpha-Cleavage): Bonds between atoms of similar electronegativities break homolytically.
Fragmentation Patterns: Weakest bonds and those forming stable cations are most likely to break.
Infrared (IR) Spectroscopy
Principle and Regions
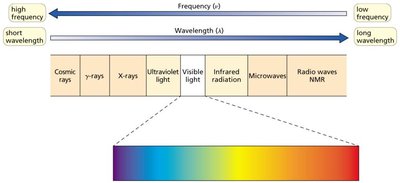
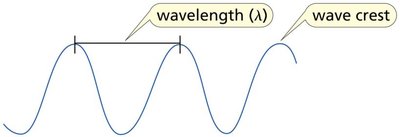
IR spectroscopy identifies functional groups by measuring bond vibrations. Each bond absorbs IR radiation at a characteristic wavenumber.
Functional Group Region: 4000–1500 cm-1; identifies functional groups.
Fingerprint Region: 1500–600 cm-1; unique to each molecule.
Bond Vibrations
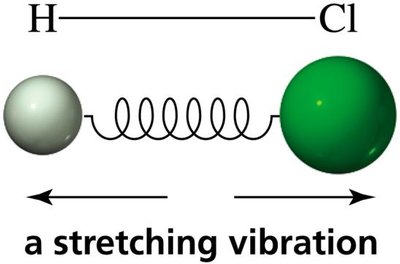
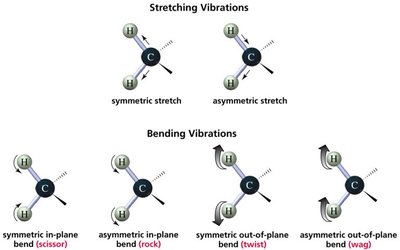
Stretching: Occurs along the bond axis.
Bending: Involves changes in bond angles.
Characteristic IR Absorptions
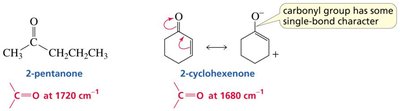
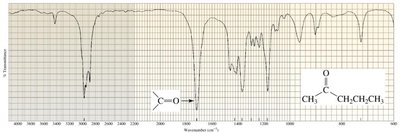
C=O: 1700 cm-1
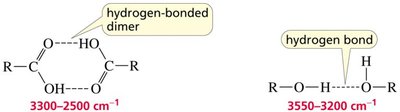
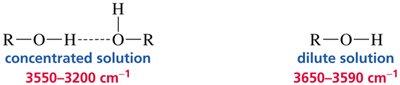
O–H: 3400 cm-1 (alcohol), 3300–2500 cm-1 (carboxylic acid)
N–H: 3500–3300 cm-1
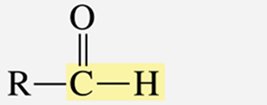
C–H: 3300–2700 cm-1
Factors Affecting IR Absorption
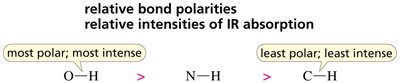
Bond Polarity: More polar bonds absorb more intensely.
Bond Order: Higher bond order (triple > double > single) leads to higher wavenumber.
Atom Mass: Lighter atoms absorb at higher wavenumbers.
Resonance and Inductive Effects: Electron delocalization lowers absorption frequency; electron withdrawal increases it.
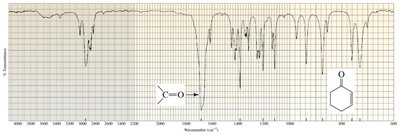
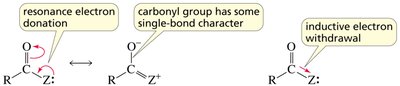
IR Spectra of Common Functional Groups
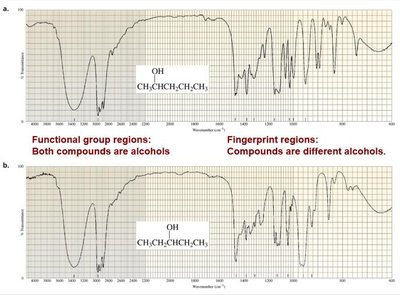
Alcohols: Broad O–H stretch.
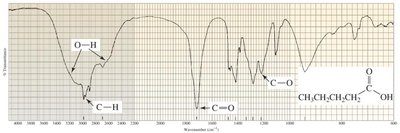
Carboxylic Acids: Broad O–H stretch, C=O stretch.
Esters: C=O and C–O stretches.
Amides: C=O stretch, N–H bend.
Amines: N–H bend.
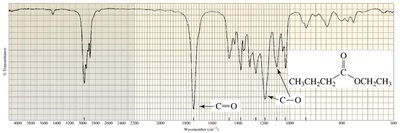
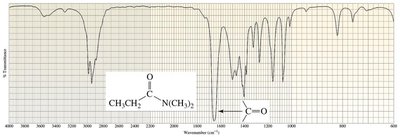

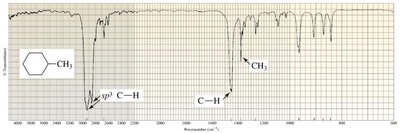
Carbon–Hydrogen Stretching and Bending
sp3 C–H: < 3000 cm-1
sp2 C–H: > 3000 cm-1
Bending: Methyl bends at 1400 cm-1 (sp3), higher for sp2.
Ultraviolet/Visible (UV/Vis) Spectroscopy
Principle and Applications
UV/Vis spectroscopy measures the absorption of light by compounds with conjugated double bonds. Only compounds with pi electrons produce UV/Vis spectra.
UV Range: 180–400 nm
Visible Range: 400–780 nm
Chromophore: The part of the molecule responsible for absorption.
Auxochrome: Substituent that alters absorption intensity and position.
Beer–Lambert Law
The Beer–Lambert Law describes the relationship between absorbance, concentration, and path length:
A: Absorbance
c: Concentration
l: Path length (cm)
\varepsilon: Molar absorptivity
Conjugation and Wavelength
More Conjugated Double Bonds: Longer wavelength (higher λmax), more intense absorption.
Colored Compounds: Absorb visible light; examples include beta-carotene and lycopene.
Applications of UV/Vis Spectroscopy
Reaction Rate Measurement: Monitors changes in absorbance over time.
Acid Ionization Constant: Differentiates between ionized and non-ionized forms.
DNA Melting Temperature: Measures absorbance changes with temperature.
Summary Table: IR Stretching Frequencies
Type of Bond | Wavenumber (cm-1) | Intensity |
|---|---|---|
C≡N triple bond | 2260–2220 | medium |
C≡C triple bond | 2260–2100 | medium to weak |
C=C double bond | 1680–1600 | medium |
C=O double bond | 1780–1650 | strong |
O–H (alcohol) | 3650–3200 | strong, broad |
O–H (carboxylic acid) | 3300–2500 | strong, very broad |
N–H | 3500–3300 | medium, broad |
C–H | 3300–2700 | medium |
Summary Table: Natural Abundance of Isotopes
Element | Isotope | Natural Abundance (%) |
|---|---|---|
Carbon | 12C | 98.89 |
Carbon | 13C | 1.11 |
Hydrogen | 1H | 99.99 |
Hydrogen | 2H | 0.01 |
Nitrogen | 14N | 99.64 |
Nitrogen | 15N | 0.36 |
Oxygen | 16O | 99.76 |
Oxygen | 17O | 0.04 |
Oxygen | 18O | 0.20 |
Sulfur | 32S | 95.0 |
Sulfur | 33S | 0.76 |
Sulfur | 34S | 4.22 |
Sulfur | 36S | 0.02 |
Fluorine | 19F | 100 |
Chlorine | 35Cl | 75.77 |
Chlorine | 37Cl | 24.23 |
Bromine | 79Br | 50.69 |
Bromine | 81Br | 49.31 |
Iodine | 127I | 100 |
Key Equations
Example: Mass Spectrum Interpretation
For pentane, the molecular ion peak at m/z = 72 indicates the molecular mass. Fragmentation leads to peaks at m/z = 43, 29, 57, and 15, corresponding to different carbocations and radicals.
Example: IR Spectrum Interpretation
An alcohol shows a broad O–H stretch around 3400 cm-1, while a carboxylic acid shows a broad O–H stretch and a strong C=O stretch.
Example: UV/Vis Spectrum Interpretation
Beta-carotene, with many conjugated double bonds, absorbs visible light and appears colored.
Conclusion
Mass spectrometry, IR spectroscopy, and UV/Vis spectroscopy are essential tools for organic chemists. They provide detailed information about molecular structure, functional groups, and electronic properties, enabling the identification and characterization of organic compounds.
