 뒤로
뒤로Infrared Spectroscopy and Mass Spectrometry: Principles and Applications
스터디 가이드 - 스마트 노트
 자료에 맞춘 맞춤형 노트, 핵심 정의, 예시, 맥락을 확장해 제공합니다.
Infrared Spectroscopy and Mass Spectrometry
Introduction to Spectroscopy
Spectroscopy is a set of analytical techniques used to determine the structure of organic compounds by measuring their interaction with electromagnetic radiation. Most spectroscopic methods are nondestructive, preserving the sample for further analysis. Absorption spectroscopy, in particular, measures the amount of light absorbed by a sample as a function of wavelength, providing valuable structural information.
Infrared (IR) Spectroscopy: Measures bond vibration frequencies to identify functional groups.
Mass Spectrometry (MS): Fragments molecules and measures the mass of the fragments, revealing molecular weight and structural features.
Nuclear Magnetic Resonance (NMR) Spectroscopy: Analyzes hydrogen environments to deduce alkyl and functional group presence.
Ultraviolet (UV) Spectroscopy: Uses electronic transitions to determine bonding patterns.
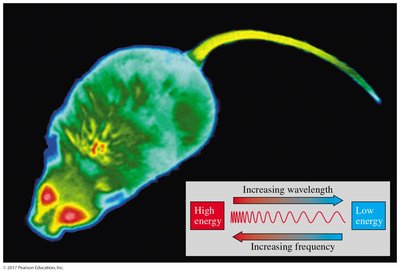
The Electromagnetic Spectrum
The electromagnetic spectrum encompasses all types of electromagnetic radiation, classified by wavelength and energy. Frequency (ν) and wavelength (λ) are inversely proportional, and energy is directly proportional to frequency:
c = λν (where c is the speed of light)
E = hν (where h is Planck’s constant)
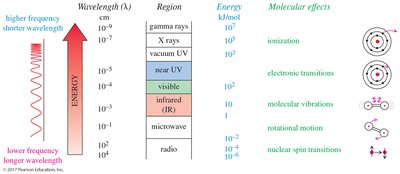
Different regions of the spectrum cause different molecular effects, such as ionization, electronic transitions, molecular vibrations, rotational motion, and nuclear spin transitions.
Infrared (IR) Spectroscopy
The IR Region and Wavenumbers
The IR region lies just below the visible spectrum and above microwave frequencies. IR wavelengths are commonly expressed in wavenumbers (cm–1), which are directly proportional to frequency and energy. The IR spectrum is divided into the functional group region (1600–3500 cm–1) and the fingerprint region (600–1400 cm–1).
Molecular Vibrations
Molecules absorb IR radiation when the frequency of the radiation matches the vibrational frequency of a bond. Bonds behave like springs, stretching and compressing around an equilibrium bond length.
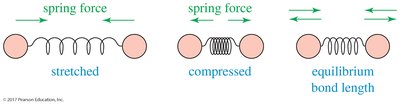
Stretching: Atoms move apart, restoring force pulls them together.
Compression: Atoms move closer, restoring force pushes them apart.
Bond Stretching Frequencies
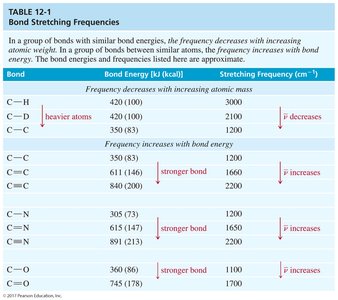
The frequency of bond stretching depends on atomic mass and bond energy. Heavier atoms vibrate at lower frequencies, while stronger bonds vibrate at higher frequencies.
Bond | Bond Energy (kcal) | Stretching Frequency (cm–1) |
|---|---|---|
C–H | 420 (100) | 3000 |
C–D | 350 (83) | 2100 |
C–C | 350 (83) | 1200 |
C=C | 611 (146) | 1660 |
C≡C | 200 (200) | 2100 |
C–N | 305 (73) | 1200 |
C=N | 615 (147) | 1650 |
C≡N | 891 (213) | 2250 |
C–O | 360 (86) | 1100 |
C=O | 745 (178) | 1700 |
Vibrational Modes
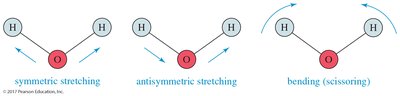
Nonlinear molecules with n atoms have 3n – 6 fundamental vibrational modes. For example, water (H2O) has three modes: two stretching (symmetric and antisymmetric) and one bending (scissoring).
Effect of an Electric Field on a Polar Bond
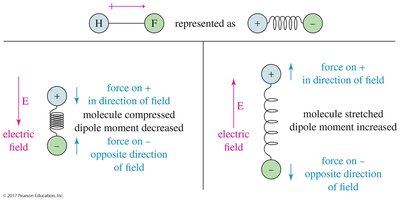
Polar bonds (e.g., H–F) interact with electric fields, which can stretch or compress the bond, altering the dipole moment and affecting IR absorption.
IR Spectrometers
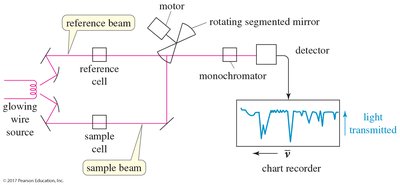
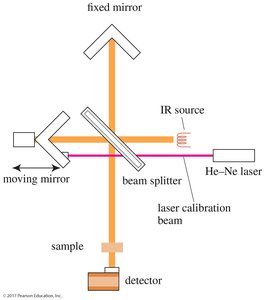
Traditional IR spectrometers use a glowing wire source, monochromator, and detector to measure transmitted light. FT-IR (Fourier Transform Infrared) spectrometers use a laser for calibration, a beam splitter, and moving mirrors for rapid, sensitive scans.
The Interferogram and Frequency Domain
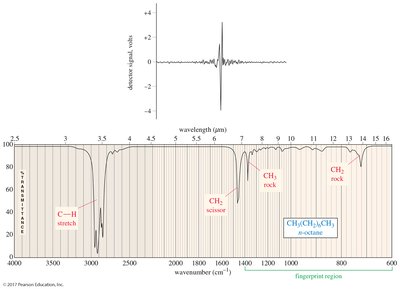
FT-IR spectrometers collect data in the time domain (interferogram), which is converted to the frequency domain using a Fourier transform, producing the IR spectrum.
Fingerprint and Functional Group Regions
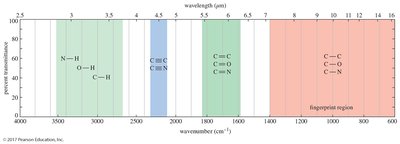
The fingerprint region (600–1400 cm–1) contains complex vibrations unique to each molecule, while the functional group region (1600–3500 cm–1) provides information about specific functional groups.
Characteristic IR Absorptions
C–H Stretching: 2800–3000 cm–1 (alkanes), 3000–3100 cm–1 (alkenes), 3300 cm–1 (alkynes)
C=O Stretching: ~1710 cm–1 (ketones, aldehydes, acids)
O–H Stretching: Broad, ~3300 cm–1 (alcohols), 2500–3500 cm–1 (acids)
N–H Stretching: ~3300 cm–1 (amines, amides)
C≡N Stretching: 2200–2300 cm–1 (nitriles)
Summary Table of IR Stretching Frequencies
Frequency (cm–1) | Functional Group | Comments |
|---|---|---|
3300 | alcohol, amine, amide, alkyne | always broad (O–H), may be broad/sharp (N–H), sharp (C≡C–H) |
3000 | alkane, alkene | just below 3000 (alkane), just above 3000 (alkene) |
2200 | alkyne, nitrile | just below 2200 (alkyne), just above 2200 (nitrile) |
1710 | carbonyl (C=O) | very strong; ketones, acids, esters, aldehydes |
1660 | alkene, imine, amide | conjugation lowers frequency; amides lower than C=O |
Mass Spectrometry (MS)
Principles of Mass Spectrometry
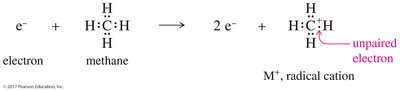
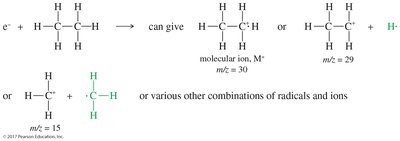
Mass spectrometry is a destructive analytical technique that provides molecular weight and structural information by ionizing molecules and analyzing the resulting fragments. The sample is bombarded with high-energy electrons, forming radical cations and fragment ions.
Radical Cation (M+): Formed by loss of one electron; has a positive charge and an unpaired electron.
Fragmentation: C–C and C–H bonds break, producing various ions; only positive ions are detected.
Mass Spectrometer Operation
Ions are separated by magnetic deflection based on their mass-to-charge ratio (m/z). Lighter ions are bent more than heavier ions. The abundance of each ion is plotted to produce a mass spectrum.
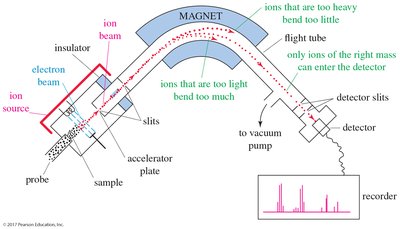
Base Peak: Tallest peak, assigned 100% abundance.
Molecular Ion (M+): Peak corresponding to the molecular weight of the compound.
Isotopic Patterns and High-Resolution MS
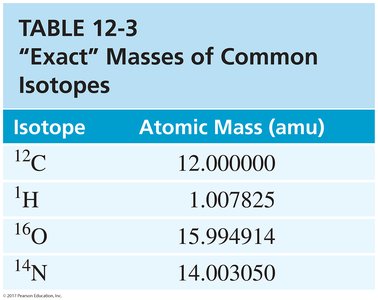
Isotopic abundances affect the appearance of the mass spectrum. High-resolution MS can distinguish between compounds with similar nominal masses by measuring exact masses.
Isotope | Atomic Mass (amu) |
|---|---|
12C | 12.000000 |
1H | 1.007825 |
16O | 15.994914 |
14N | 14.003050 |
Fragmentation Patterns
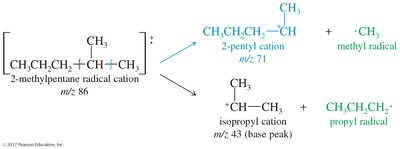
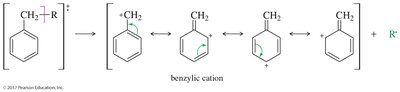
Fragmentation in MS often produces the most stable carbocations. Resonance-stabilized cations (e.g., allylic, benzylic) are favored. The fragmentation pattern provides clues to the structure of the original molecule.
Alkanes: Fragment to give peaks corresponding to loss of methyl, ethyl, propyl, etc.
Branched Alkanes: More stable carbocations are favored.
Alkenes: Allylic cleavage forms resonance-stabilized cations.
Aromatics: Benzylic cleavage forms resonance-stabilized benzylic cations.
Applications and Limitations
IR and MS are complementary techniques for identifying functional groups and determining molecular structure.
IR is definitive for the absence of a functional group, but ambiguous signals may require confirmation by other methods.
MS provides molecular weight and fragmentation patterns but destroys the sample.
Example: The IR spectrum of an unknown compound shows a strong absorption at 1710 cm–1 (C=O), two peaks at 2720 and 2820 cm–1 (aldehyde C–H), and a weak peak at 3400 cm–1 (possible O–H impurity). This suggests the compound is an aldehyde.
Additional info: For further study, students should practice interpreting IR and MS spectra using known compounds and reference tables to build familiarity with characteristic absorptions and fragmentation patterns.
