 뒤로
뒤로Spectroscopy and Structure Determination in Organic Chemistry: IR, Mass Spectrometry, and NMR
스터디 가이드 - 스마트 노트
 자료에 맞춘 맞춤형 노트, 핵심 정의, 예시, 맥락을 확장해 제공합니다.
Spectroscopy in Organic Chemistry
Introduction to Spectroscopy
Spectroscopy is a set of analytical techniques used to determine the structure and composition of organic molecules by studying their interaction with electromagnetic radiation. The three main spectroscopic methods in organic chemistry are Infrared (IR) Spectroscopy, Mass Spectrometry (MS), and Nuclear Magnetic Resonance (NMR) Spectroscopy.
IR Spectroscopy: Identifies functional groups by measuring molecular vibrations.
Mass Spectrometry: Determines molecular mass and formula by analyzing ionized fragments.
NMR Spectroscopy: Reveals the number, environment, and connectivity of hydrogen and carbon atoms.
Electromagnetic Radiation and Molecular Energy
Wave-Particle Duality and Energy Relationships
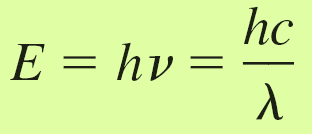
Light exhibits both wave-like and particle-like properties. The energy of electromagnetic radiation is related to its frequency and wavelength by the following equations:
Energy-Frequency-Wavelength Relationship:
Frequency-Wavelength Relationship:
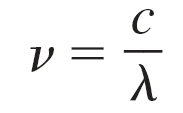
Where is energy, is Planck's constant, is frequency, is the speed of light, and is wavelength.
Wavelength and Frequency: Wavelength is the distance between two consecutive peaks of a wave, while frequency is the number of waves passing a point per second (Hz).


Infrared (IR) Spectroscopy
Principles and Interpretation
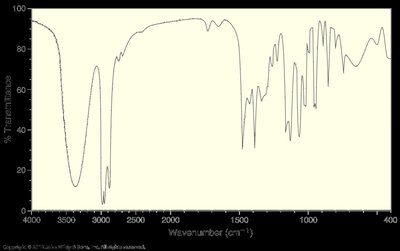
IR spectroscopy measures the absorption of IR radiation by molecules, causing vibrational transitions. The resulting spectrum provides information about the types of bonds and functional groups present.
Key Features of IR Spectra:
Wavenumber (cm–1): Indicates the energy of absorption.
Intensity: Reflects the strength of absorption (related to dipole moment changes).
Shape: Broad or sharp peaks can indicate hydrogen bonding or specific functional groups.
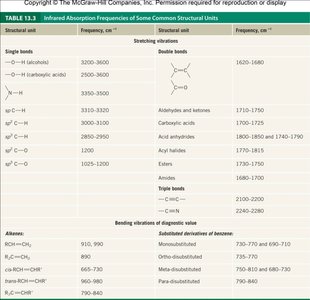
Characteristic absorption frequencies help identify functional groups:
Analyzing IR Spectra
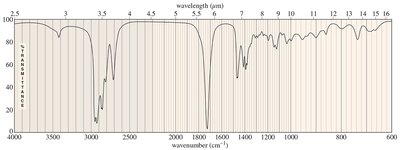
Label peaks with corresponding bond types (e.g., O—H, C=O, C—H).
The fingerprint region (600–1500 cm–1) is unique for each molecule but often too complex for direct interpretation.
The absence of a signal is strong evidence that a functional group is not present.
Mass Spectrometry (MS)
Principles and Interpretation
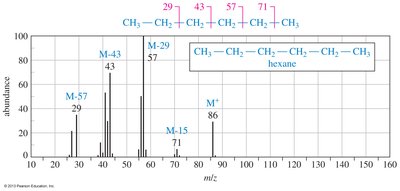
Mass spectrometry ionizes molecules and separates the resulting ions based on their mass-to-charge ratio (m/z). The spectrum provides information about the molecular mass, formula, and structure through fragmentation patterns.
Molecular Ion (M+): The ion corresponding to the intact molecule; its m/z value gives the molecular mass.
Base Peak: The most intense peak, set to 100% relative abundance.
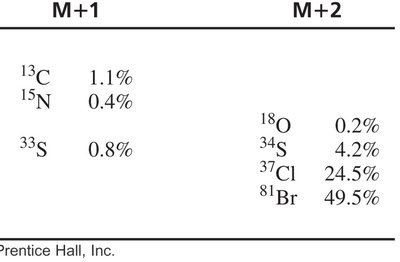
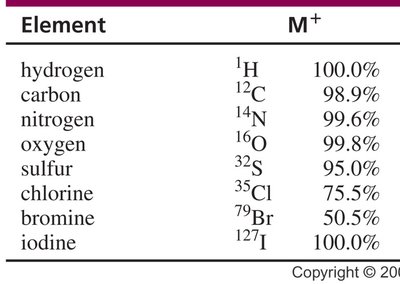
Isotopic Peaks: Peaks at M+1, M+2, etc., arise from naturally occurring isotopes (e.g., 13C, 37Cl, 81Br).
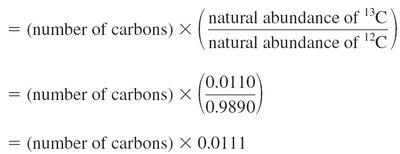
The relative abundance of isotopic peaks can be calculated:
Fragmentation Patterns
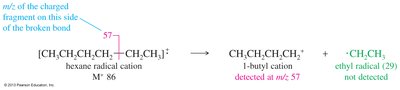
Fragmentation yields ions and neutral species; only ions are detected.
Stable fragments are more likely to appear as significant peaks.
Nuclear Magnetic Resonance (NMR) Spectroscopy
Principles of NMR
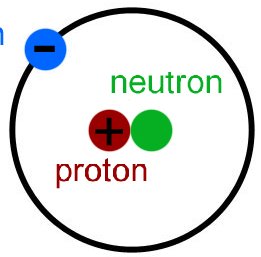
NMR spectroscopy exploits the magnetic properties of certain nuclei (e.g., 1H, 13C) to provide detailed information about molecular structure. Nuclei with an odd number of protons or neutrons possess spin and behave like tiny magnets.
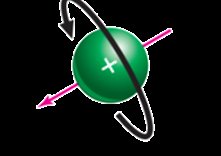
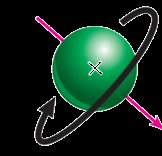

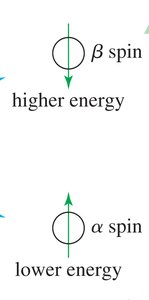
In an external magnetic field, nuclear spins align either with (α, lower energy) or against (β, higher energy) the field.
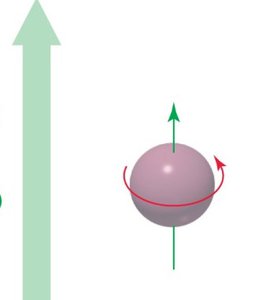
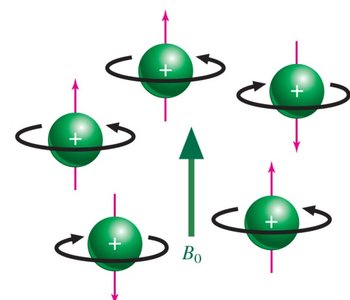
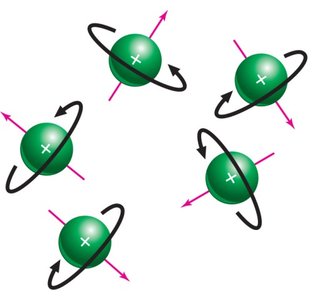
The energy difference between spin states increases with magnetic field strength.
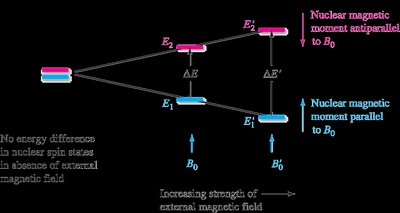

NMR Absorption and Resonance
When a nucleus in the α-spin state absorbs radiofrequency energy, it flips to the β-spin state (resonance).
The absorption is detected as an NMR signal.
Information from 1H NMR Spectra
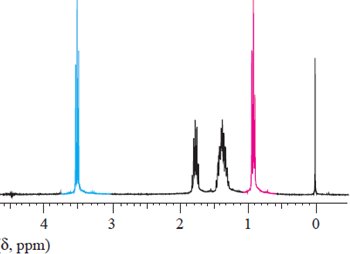
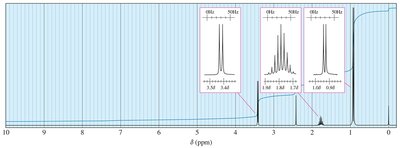
Number of Signals: Indicates the number of chemically non-equivalent sets of protons.
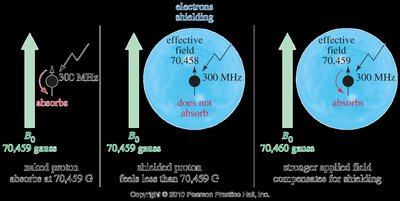
Chemical Shift (δ): Reveals the electronic environment of protons (measured in ppm relative to TMS).
Integration: The area under each peak is proportional to the number of protons in that environment.
Spin-Spin Splitting: The splitting pattern (multiplicity) reveals the number of adjacent protons (n+1 rule).

Integration and Structural Information
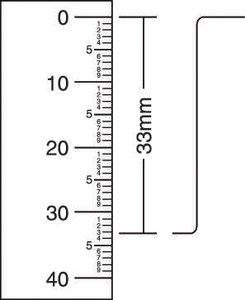
Integration curves measure the relative number of protons for each signal.
Equivalent protons give one signal; the integral ratio reflects the number of protons in each environment.
Spin-Spin Splitting and the n+1 Rule
Splitting arises from the influence of neighboring protons.
A proton with n adjacent protons appears as an (n+1)-multiplet.


Chemical Shift Reference and Interpretation
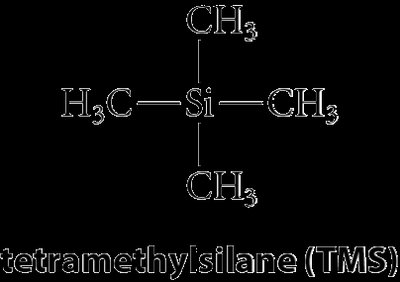
Chemical Shift (δ): Position of absorption, measured in ppm relative to tetramethylsilane (TMS, δ = 0.0 ppm).
TMS is used as an internal standard because it is inert and produces a single, sharp signal.
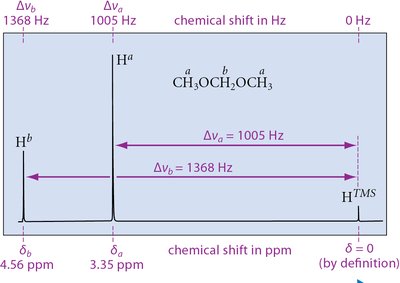
13C NMR Spectroscopy
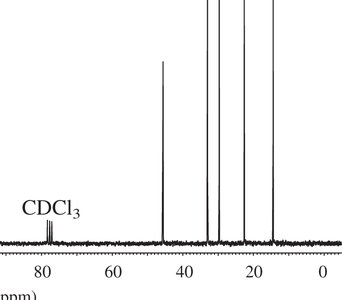
13C NMR provides information about the number and type of carbon environments in a molecule.
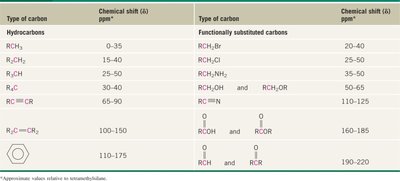
Chemical shifts are influenced by electronegativity and hybridization of attached groups.
Signals are not normally integrated; symmetry can be inferred from the number of signals.
Worked Examples and Applications
IR and NMR Problem Solving
Identify functional groups from IR spectra by locating characteristic peaks (e.g., O—H, C=O, C—H).
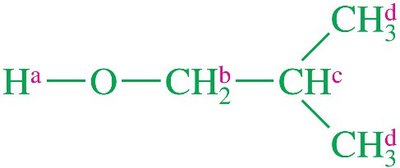
Use NMR chemical shifts, integration, and splitting to deduce molecular structure.

Synthesis and Reaction Mechanisms
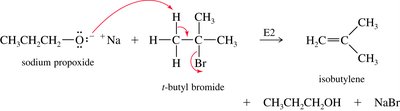
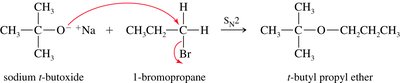
Choose appropriate substrates for SN2 ether synthesis (less hindered alkyl halide).
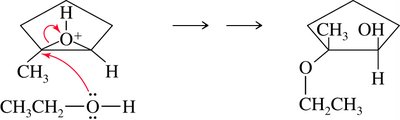
Predict products of epoxide ring opening under basic and acidic conditions.


Summary Table: Characteristic IR Absorptions
Bond Type | Wavenumber (cm–1) | Intensity/Shape |
|---|---|---|
O—H (alcohol) | 3200–3600 | Broad, strong |
N—H | 3300–3500 | Medium, sharp |
C—H (sp3) | 2850–2960 | Variable |
C=O (carbonyl) | 1700–1750 | Strong, sharp |
C=C (alkene) | 1620–1680 | Variable |
Additional info: Table values are approximate and may shift depending on conjugation, ring strain, or hydrogen bonding.
Key Equations
Energy of a photon:
Frequency-wavelength relationship:
Isotopic abundance (for M+1 peak):
