 뒤로
뒤로Measurement and Uncertainty: Foundations for Physics
스터디 가이드 - 스마트 노트
 자료에 맞춘 맞춤형 노트, 핵심 정의, 예시, 맥락을 확장해 제공합니다.
Measurement and Uncertainty
Scientific Method
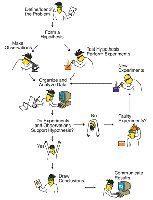
The scientific method is a systematic approach used in physics to investigate phenomena, acquire new knowledge, or correct and integrate previous knowledge. It involves defining a problem, forming a hypothesis, conducting experiments, analyzing data, and communicating results. Peer review and replication are essential for validating findings.
Define the Problem: Identify the question or issue to be studied.
Form a Hypothesis: Propose a testable explanation.
Conduct Experiments: Design and perform experiments to test the hypothesis.
Analyze Data: Interpret results using theoretical concepts and formulae.
Communicate Results: Share findings with the scientific community for peer review and replication.
Units and Measurement
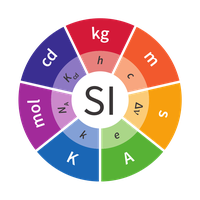
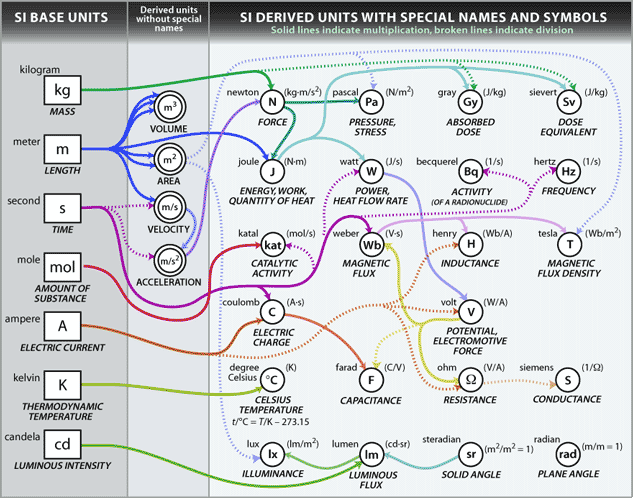
Physics relies on standardized units to ensure consistency and comparability of measurements worldwide. The International System of Units (SI) is the most widely used system, with seven fundamental units and numerous derived units.
SI Units: Meter (m), kilogram (kg), second (s), Kelvin (K), ampere (A), mole (mol), candela (cd).
Derived Units: Formed by combining base units (e.g., Newton for force, Joule for energy).
mks System: Refers to meter, kilogram, and second as the primary units for length, mass, and time.
Prefixes: Used to express multiples or fractions of units (e.g., kilo-, milli-, micro-).
Scientific Notation and Significant Figures
Scientific notation is a convenient way to represent very large or very small numbers. Significant figures indicate the precision of a measurement and are crucial for reporting and calculating results accurately.
Scientific Notation: Expresses numbers as a decimal value between 1 and 10 multiplied by a power of ten (e.g., m).
Significant Figures: All non-zero digits are significant; zeros between non-zero digits are significant; leading zeros are not significant; trailing zeros are significant if to the right of a decimal point.
Rules: Use scientific notation to avoid confusion; round results according to the least precise data.
Calculations with Significant Figures
When performing calculations, the precision of the result is limited by the least precise measurement.
Multiplication/Division: Round the result to the same number of significant figures as the least precise data.
Addition/Subtraction: Round the result to the same decimal place as the last significant figure of the least precise data.
Uncertainty in Measurement
Every physical measurement has an associated uncertainty, reflecting the limitations of the measuring instrument and the process.
Absolute Uncertainty (): The possible variation from the stated value (e.g., ).
Limit of Reading: Often taken as half the smallest scale division.
Reporting: Only quote one significant figure in uncertainty; match the precision of the measurement to the uncertainty.
Repeated Measurements and Statistical Analysis
Reliability can be improved by repeating measurements and analyzing the spread of data.
Mean Value (): Average of repeated measurements.
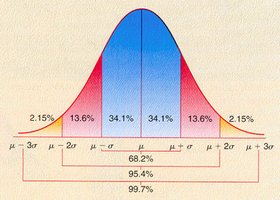
Standard Deviation (): Measures the spread of data; for a normal distribution, ~68% of values lie within of the mean.
Standard Error (): where is the number of measurements.
Precision and Accuracy
Precision refers to the reproducibility of measurements, while accuracy describes how close a measurement is to the true value.
Precision: Small uncertainty, many significant figures.
Accuracy: Measurement close to the accepted value.
Possible scenarios: Precise but inaccurate, accurate but imprecise, accurate and precise.
Calculations with Uncertainties
When combining uncertain quantities, the uncertainty in the result increases. The "worst case scenario" assumes maximum uncertainty.
Addition/Subtraction: Add absolute uncertainties: , .
Multiplication/Division: Add relative uncertainties: ; always quote final answer with absolute uncertainty.
Relative Uncertainty:
Percentage Uncertainty:
Systematic and Random Errors
Errors in measurement can be classified as systematic or random.
Systematic Errors: Regular, repeatable errors due to instrument calibration or consistent bias. Can often be corrected.
Random Errors: Fluctuating, unpredictable errors due to intrinsic variability or external influences. Reduced by repeated measurements.


Uncertainties in Linear Graphs
Graphs are used to display data and reveal trends. Uncertainties in the gradient and intercept can be estimated by comparing the best fit line to an uncertainty line.
Gradient (): Slope of the line; uncertainty where is the slope of the uncertainty line.
Intercept (): Y-intercept; uncertainty .
Linear Regression: Statistical method to determine best fit and uncertainties using software tools like Excel.
Key Distinctions
Significant Figures vs. Decimal Places: Significant figures reflect precision; decimal places indicate the position of the last digit.
Errors vs. Uncertainties: Errors are deviations from the true value; uncertainties quantify the range of possible values.
Absolute, Relative, and Percentage Uncertainties: Absolute is the raw uncertainty; relative is the ratio to the measured value; percentage is the relative uncertainty expressed as a percent.
Systematic vs. Random Errors: Systematic errors are consistent and correctable; random errors are unpredictable and reduced by averaging.
