Ch. 02 - Describing Motion: Kinematics in One Dimension
Giancoli Douglas - Physics for Scientists and Engineers 5th edition
Giancoli Douglas5th editionPhysics for Scientists and EngineersISBN: 9780137488179당신이 사용하는 게 아니라요?교과서 변경
2장, 문제 18

Sketch the v vs. t graph for the object whose displacement as a function of time is given by Fig. 2–40.

검증된 단계별 안내
1
Analyze the displacement vs. time graph (Fig. 2–40) to determine the slope of the graph at different time intervals. The slope of a displacement vs. time graph represents the velocity of the object.
Identify the regions of the graph where the slope is constant, increasing, decreasing, or zero. A constant slope indicates constant velocity, an increasing slope indicates acceleration, a decreasing slope indicates deceleration, and a zero slope indicates the object is at rest.
For each time interval, calculate the slope of the displacement vs. time graph. Use the formula for slope: \( \text{slope} = \frac{\Delta y}{\Delta x} \), where \( \Delta y \) is the change in displacement and \( \Delta x \) is the change in time.
Plot the calculated slopes (velocities) on a velocity vs. time graph. Ensure that the velocity values correspond to the correct time intervals from the displacement vs. time graph.
Connect the points on the velocity vs. time graph appropriately. If the slope of the displacement graph changes linearly, the velocity graph will show a straight line. If the slope changes abruptly, the velocity graph will have a sharp transition.

비슷한 문제에 대한 검증된 영상 답변:

이 영상 해법은 위 문제에 도움이 된다고 튜터들이 추천한 것입니다.
영상 길이:
7m
도움이 되었나요?

주요 개념

질문에 올바르게 답하기 위해 반드시 이해해야 하는 핵심 개념들은 다음과 같습니다.

Displacement vs. Time Relationship

Displacement as a function of time describes how the position of an object changes over time. The slope of the displacement vs. time graph indicates the object's velocity. A steeper slope represents a higher velocity, while a flat line indicates the object is at rest. Understanding this relationship is crucial for interpreting how displacement affects velocity.
추천 영상:
가이드 코스
06:13
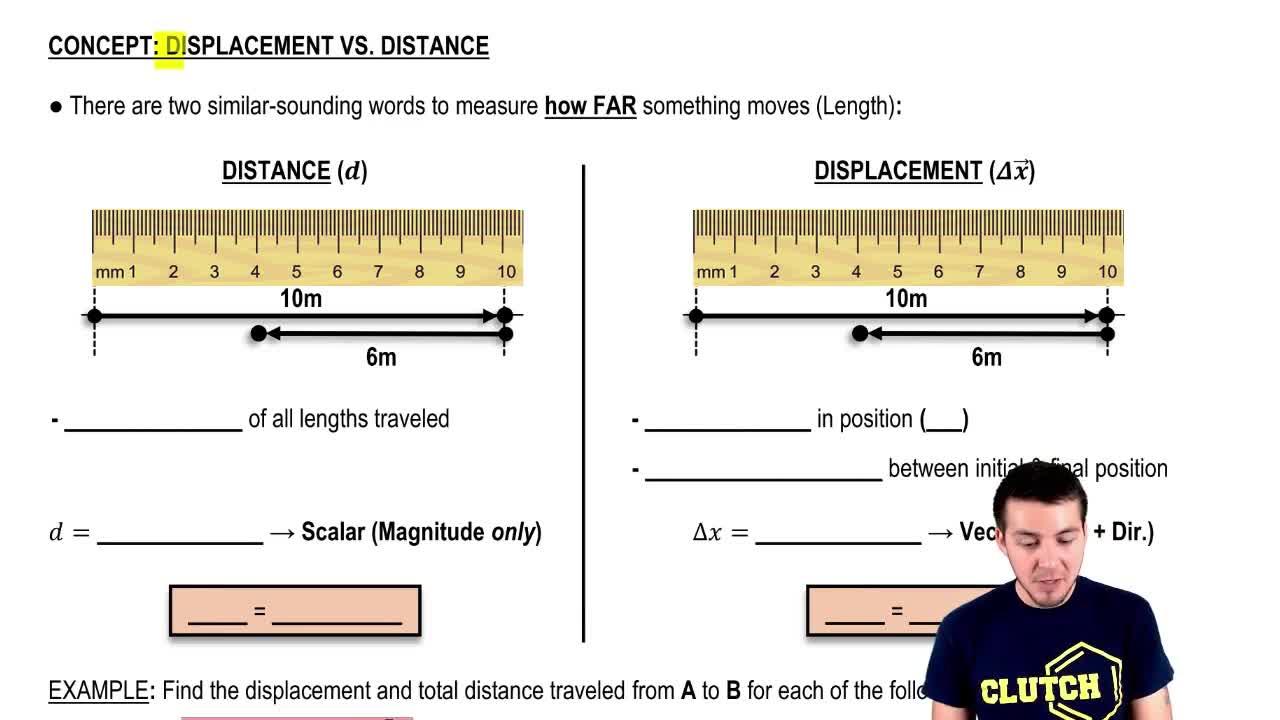
Displacement vs. Distance

Velocity vs. Time Graph

The velocity vs. time graph represents how an object's velocity changes over time. The area under the velocity curve corresponds to the displacement of the object. If the velocity is constant, the graph will be a horizontal line, while varying velocity will create a curve. This graph is essential for visualizing motion and understanding acceleration.
추천 영상:
가이드 코스
05:59
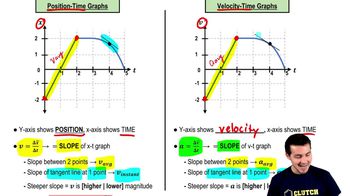
Velocity-Time Graphs & Acceleration

Graphical Interpretation of Motion

Graphical interpretation involves analyzing graphs to extract information about an object's motion. By sketching the velocity vs. time graph based on the displacement graph, one can identify key features such as acceleration, deceleration, and constant velocity. This skill is vital for solving problems in kinematics and understanding the dynamics of moving objects.
추천 영상:
가이드 코스
05:58
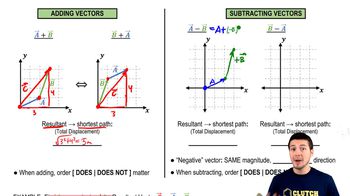
Subtracting Vectors Graphically