3. Functions & Graphs
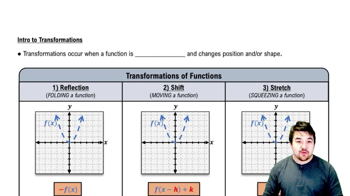
Transformations
3. Functions & Graphs
Transformations
 5:25
5:25

총 9개 중 9개 비디오 표시
이 주제를 연습하세요
- 객관식
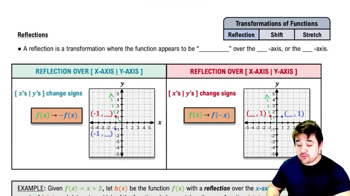
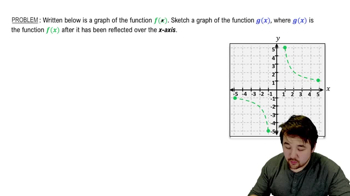
Written below (green dotted curve) is a graph of the function .If g(x) (blue solid curve) is a reflection of f(x) about the y-axis what is the equation for g(x)?
538views6rank1comments - 객관식
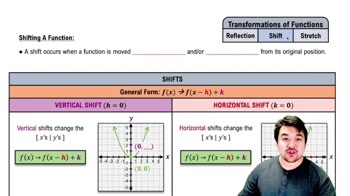
The green dotted line in the graph below represents the function . The blue solid line represents the function , which is the function after it has gone through a shift transformation. Find the equation for .
539views19rank - 객관식
The green dotted curve below is a graph of the function . Find the domain and range of (the blue solid curve), which is a transformation of .
501views17rank - 객관식What is the effect on the graph of when it is replaced by ?120views