뒤로
뒤로Graphs and Graphing Utilities in Precalculus
스터디 가이드 - 스마트 노트
 자료에 맞춘 맞춤형 노트, 핵심 정의, 예시, 맥락을 확장해 제공합니다.
Graphs and Graphing Utilities
Introduction to the Rectangular Coordinate System
The rectangular coordinate system (also called the Cartesian plane) is a fundamental tool in algebra and precalculus for visualizing relationships between variables. It consists of two perpendicular number lines: the x-axis (horizontal) and the y-axis (vertical), which intersect at the origin (0, 0).
Positive numbers are to the right of the origin on the x-axis and above the origin on the y-axis.
Negative numbers are to the left of the origin on the x-axis and below the origin on the y-axis.
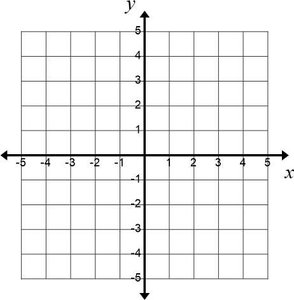
Plotting Points in the Rectangular Coordinate System
Each point in the plane is represented by an ordered pair (x, y):
The x-coordinate indicates the horizontal position (right for positive, left for negative).
The y-coordinate indicates the vertical position (up for positive, down for negative).
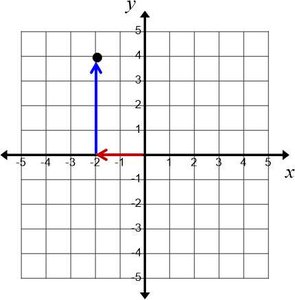
Example: To plot (−2, 4), move 2 units left and 4 units up from the origin.
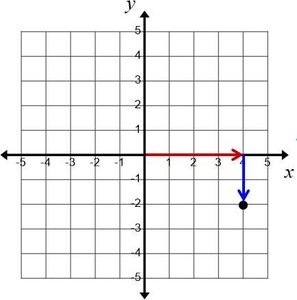
Example: To plot (4, −2), move 4 units right and 2 units down from the origin.
Graphs of Equations
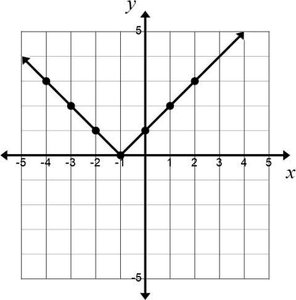
A graph of an equation in two variables (x and y) is the set of all points (x, y) that satisfy the equation. For example, the equation can be graphed by finding ordered pairs that make the equation true.
To graph an equation, select values for x, compute the corresponding y values, and plot the resulting points.
Example Table:
x | y = |x + 1| | Ordered Pair (x, y) |
|---|---|---|
-4 | 3 | (-4, 3) |
-3 | 2 | (-3, 2) |
-2 | 1 | (-2, 1) |
-1 | 0 | (-1, 0) |
0 | 1 | (0, 1) |
1 | 2 | (1, 2) |
2 | 3 | (2, 3) |
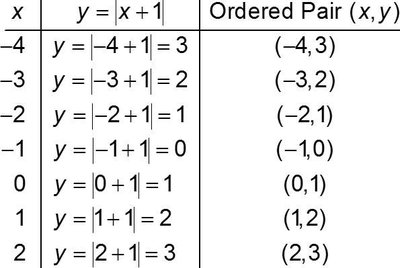
Plot these points and connect them to form the graph of the equation.
Graphing Utilities and Viewing Rectangles
Graphing utilities (such as calculators or software) allow you to graph equations by entering them and setting the viewing rectangle, which determines the visible portion of the coordinate plane.
The viewing rectangle is defined by minimum and maximum x and y values, and the scale (distance between tick marks).
The standard viewing rectangle is typically [−10, 10, 1] by [−10, 10, 1].
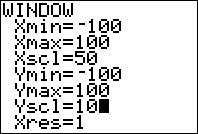
Example: A viewing rectangle of [−100, 100, 50] by [−100, 100, 10] means:
x ranges from −100 to 100, with tick marks every 50 units
y ranges from −100 to 100, with tick marks every 10 units
Intercepts of Graphs
Intercepts are points where a graph crosses the axes:
x-intercept: The x-coordinate where the graph crosses the x-axis (y = 0).
y-intercept: The y-coordinate where the graph crosses the y-axis (x = 0).
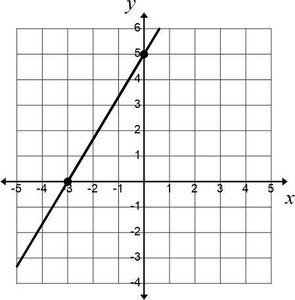
Example: The graph crosses the x-axis at (−3, 0) and the y-axis at (0, 5).
Interpreting Information from Graphs
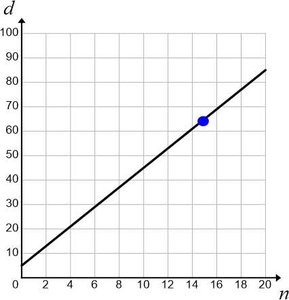
Graphs can be used to model and interpret real-world situations. For example, the equation models the percentage of marriages ending in divorce after n years if the wife is under 18 at marriage.
To find the percentage after 15 years, substitute n = 15:
So, 65% of such marriages end in divorce after 15 years. This can be checked by locating the point (15, 65) on the graph of the equation.