 뒤로
뒤로Introduction to Graphing and Functions in Precalculus
스터디 가이드 - 스마트 노트
 자료에 맞춘 맞춤형 노트, 핵심 정의, 예시, 맥락을 확장해 제공합니다.
Sec 1.1 Introduction to Graphing
Graphs and Solutions of Equations
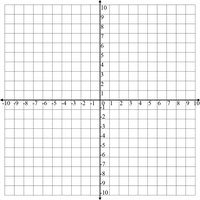
A graph is a visual representation that helps display, interpret, and analyze mathematical data. The solution(s) of an equation are the value(s) of the variable(s) that make the equation true. The graph of an equation is the set of all solutions of that equation, plotted as points in the coordinate plane.
Example: For the equation , ordered pairs such as (2, 3) and (3, 2) can be tested to see if they are solutions by substituting into the equation.
Methods to Graph Linear Equations
There are several methods to graph linear equations:
Plotting Points: Create ordered pairs (x, y) that satisfy the equation and plot them on the coordinate plane.
Finding Intercepts: Determine where the graph crosses the x-axis (x-intercept) and y-axis (y-intercept).
Using Slope and Y-Intercept: For equations in the form , m is the slope and b is the y-intercept.
Linear Equations
Linear equations involve variables to the first degree and graph as straight lines. Common forms include:
Standard Form:
Slope-Intercept Form:
Quadratic Equations
Quadratic equations have one variable raised to the second degree and graph as parabolas. The standard form is:
Distance Formula
The distance formula calculates the distance between two points and :
Example: Find the distance between and .
Midpoint Formula
The midpoint formula finds the point exactly halfway between two points and :
Example: Find the midpoint between and .
Sec 1.2 Functions and Graphs
Relations and Functions
A relation is a correspondence between two sets, often expressed as mappings, ordered pairs, equations, or graphs. A function is a special type of relation where each input (x-value) corresponds to exactly one output (y-value).
Domain: The set of all possible input values (x-values).
Range: The set of all possible output values (y-values).
Independent Variable: Usually x (input).
Dependent Variable: Usually y (output).
Function Notation
Functions are often written in the form , where f is the function name and x is the input. For example, can be written as .
To evaluate a function: Substitute the given value for x and compute the result.
Example: For , find , , and .
Vertical Line Test
The Vertical Line Test is used to determine if a graph represents a function. If any vertical line crosses the graph more than once, the graph does not represent a function.
Domain and Range
The domain of a function is the set of all real numbers for which the function is defined. The range is the set of all possible output values. To find the domain, exclude any input values that make the function undefined (such as division by zero or taking the square root of a negative number).
Example: Determine the domain for the following functions:
