 뒤로
뒤로Introduction to the Cartesian Coordinate System and Graphs
스터디 가이드 - 스마트 노트
 자료에 맞춘 맞춤형 노트, 핵심 정의, 예시, 맥락을 확장해 제공합니다.
Graphs and the Cartesian Coordinate System
The Cartesian Plane
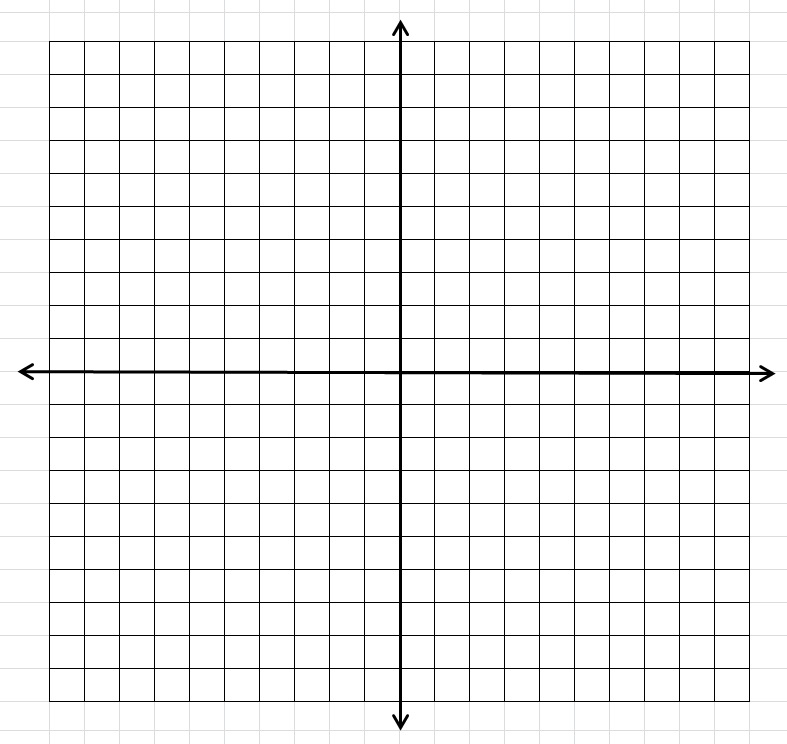
The Cartesian coordinate system is a two-dimensional plane formed by two perpendicular number lines: the x-axis (horizontal) and the y-axis (vertical). The point where these axes intersect is called the origin, denoted as (0, 0). This system is fundamental for graphing equations and visualizing mathematical relationships in Precalculus.
X-axis: The horizontal axis, typically representing the independent variable.
Y-axis: The vertical axis, typically representing the dependent variable.
Origin: The intersection point of the axes, coordinates (0, 0).
Quadrants: The plane is divided into four regions called quadrants, numbered I to IV counterclockwise starting from the upper right.
Example: The point (3, -2) is located 3 units to the right of the origin and 2 units down.
Plotting Points
To plot a point on the Cartesian plane, use an ordered pair (x, y):
Move x units left or right from the origin (along the x-axis).
Move y units up or down from that position (along the y-axis).
Example: To plot (−4, 5), move 4 units left and 5 units up from the origin.
Applications of the Cartesian Plane
The Cartesian plane is used to:
Graph equations and inequalities
Visualize functions and their transformations
Analyze geometric figures and their properties
Additional info: The grid shown is a blank template, commonly used for plotting points, graphing lines, and visualizing functions in Precalculus.
