 뒤로
뒤로Precalculus Functions, Graphs, and Algebra Review – Guided Study Notes
스터디 가이드 - 스마트 노트
 자료에 맞춘 맞춤형 노트, 핵심 정의, 예시, 맥락을 확장해 제공합니다.
Q1. Which set of ordered pairs does not represent a function?
Background
Topic: Functions and Relations
This question tests your understanding of what makes a relation a function, specifically the requirement that each input (x-value) must correspond to exactly one output (y-value).
Key Terms:
Function: A relation in which each input has exactly one output.
Ordered Pair: A pair of numbers (x, y) representing a point in the coordinate plane.
Step-by-Step Guidance
Look at each set of ordered pairs and identify the x-values in each set.
Check if any x-value is repeated with a different y-value in the same set. If so, that set does not represent a function.
Recall: If a single x-value is paired with more than one y-value, the relation is not a function.
Go through each answer choice and list the x-values to check for repeats.
Try solving on your own before revealing the answer!
Final Answer: D
Set D has the x-value -8 paired with both 6 and -3, so it does not represent a function.
Q2. Determine whether the following graph represents a function.
Background
Topic: Functions and the Vertical Line Test
This question asks you to use the vertical line test to determine if a graph represents a function.
Key Terms:
Vertical Line Test: A graph represents a function if and only if no vertical line intersects the graph at more than one point.
Step-by-Step Guidance
Visualize or draw vertical lines at various x-values on the graph.
Check if any vertical line crosses the graph at more than one point.
If a vertical line crosses the graph more than once, the graph does not represent a function.
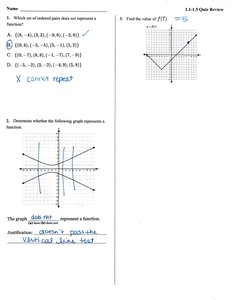
Try solving on your own before revealing the answer!
Final Answer: The graph does not represent a function.
Some vertical lines cross the graph at more than one point, so it fails the vertical line test.
Q3. Find the value of f(7) from the given graph.
Background
Topic: Evaluating Functions from Graphs
This question tests your ability to read a graph and find the output value for a given input.
Key Terms:
Function Notation: f(x) represents the output of the function when the input is x.
Step-by-Step Guidance
Locate x = 7 on the x-axis of the graph.
Move vertically from x = 7 to the point on the graph.
Read the corresponding y-value at that point. This is f(7).
Try solving on your own before revealing the answer!
Final Answer: f(7) = 5
At x = 7, the graph reaches y = 5, so f(7) = 5.
Q4. Find the domain of the function defined by the set of points below. Express your answer as a set of numbers.
Background
Topic: Domain of a Function
This question asks you to identify all possible input values (x-values) for a function given as a set of points.
Key Terms:
Domain: The set of all possible input values (x-values) for a function.
Step-by-Step Guidance
List all the x-values from the given set of points.
Write the domain as a set, using curly braces { } and listing the x-values in order.
Check for any repeated x-values and list each only once.
Try solving on your own before revealing the answer!
Final Answer: {0, 10, -3, 4}
The domain is the set of all x-values from the points: 0, 10, -3, and 4.
Q5. Find the range of the function defined by the set of points below. Express your answer as a set of numbers.
Background
Topic: Range of a Function
This question asks you to identify all possible output values (y-values) for a function given as a set of points.
Key Terms:
Range: The set of all possible output values (y-values) for a function.
Step-by-Step Guidance
List all the y-values from the given set of points.
Write the range as a set, using curly braces { } and listing the y-values in order.
Check for any repeated y-values and list each only once.
Try solving on your own before revealing the answer!
Final Answer: {-3, 2, 6, 8}
The range is the set of all y-values from the points: -3, 2, 6, and 8.
Q6. Determine the domain of the following graph.
Background
Topic: Domain from a Graph
This question tests your ability to find the set of all x-values for which the graph is defined.
Key Terms:
Domain: The set of all x-values for which the function is defined (where the graph exists horizontally).
Step-by-Step Guidance
Look at the leftmost and rightmost points of the graph to determine the interval of x-values covered.
Check if the graph includes endpoints (closed or open circles) to decide if the interval is open or closed.
Write the domain as an interval or set, as appropriate.
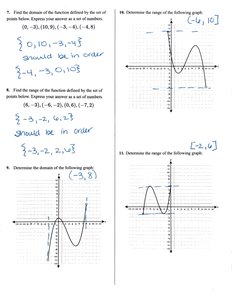
Try solving on your own before revealing the answer!
Final Answer: (-3, 8)
The domain is all x-values from -3 to 8, not including the endpoints.
Q7. Determine the range of the following graph.
Background
Topic: Range from a Graph
This question tests your ability to find the set of all y-values for which the graph is defined.
Key Terms:
Range: The set of all y-values for which the function is defined (where the graph exists vertically).
Step-by-Step Guidance
Look at the lowest and highest points on the graph to determine the interval of y-values covered.
Check if the graph includes endpoints (closed or open circles) to decide if the interval is open or closed.
Write the range as an interval or set, as appropriate.
Try solving on your own before revealing the answer!
Final Answer: [-4, 10]
The range is all y-values from -4 to 10, including the endpoints.
Q8. Determine the range of the following graph.
Background
Topic: Range from a Graph
This question tests your ability to find the set of all y-values for which the graph is defined.
Key Terms:
Range: The set of all y-values for which the function is defined (where the graph exists vertically).
Step-by-Step Guidance
Look at the lowest and highest points on the graph to determine the interval of y-values covered.
Check if the graph includes endpoints (closed or open circles) to decide if the interval is open or closed.
Write the range as an interval or set, as appropriate.
Try solving on your own before revealing the answer!
Final Answer: [2, 6]
The range is all y-values from 2 to 6, including the endpoints.
Q9. Factor x^2 + 2x - 15
Background
Topic: Factoring Quadratic Expressions
This question tests your ability to factor a quadratic trinomial into two binomials.
Key Formula:
Standard form:
Factored form: where and are numbers that multiply to and add to .
Step-by-Step Guidance
Identify , , and in the quadratic expression.
Find two numbers that multiply to and add to $2$.
Write the factored form as using those numbers.
Try solving on your own before revealing the answer!
Final Answer: (x - 3)(x + 5)
The numbers -3 and 5 multiply to -15 and add to 2, so the factorization is (x - 3)(x + 5).
