 뒤로
뒤로Chapter 2.2-2.3
스터디 가이드 - 스마트 노트
 자료에 맞춘 맞춤형 노트, 핵심 정의, 예시, 맥락을 확장해 제공합니다.
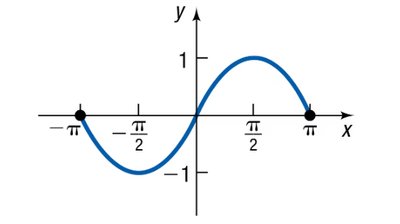
Q2. Use the graph described above to determine the following values:
Background
Topic: Reading Values from a Function's Graph
This question tests your ability to interpret a function's graph and extract specific values for at given values, as well as to find values for which equals a specified number.
Key Terms:
Function notation: represents the output of the function for input .
Graph interpretation: The -value at a given is .
Step-by-Step Guidance
Locate on the graph and find the corresponding -value. This is .
Locate on the graph and find the corresponding -value. This is .
To find where , look for points on the graph where the -value is and note the corresponding values.
Try solving on your own before revealing the answer!
Q3. Using the same graph from Question 2, identify the boundaries of the function.
Background
Topic: Domain and Range of a Function
This question tests your understanding of how to determine the domain (possible values) and range (possible values) from a graph.
Key Terms:
Domain: The set of all values for which the function is defined (horizontal extent).
Range: The set of all values the function takes (vertical extent).
Step-by-Step Guidance
Examine the graph from left to right to determine the smallest and largest values where the graph exists. These are the domain boundaries.
Examine the graph from bottom to top to determine the lowest and highest values the graph reaches. These are the range boundaries.
Try solving on your own before revealing the answer!
Q4. Given , find all intercepts algebraically.
Background
Topic: Algebraic Intercepts of Functions
This question tests your ability to find -intercepts (where the graph crosses the -axis) and -intercepts (where the graph crosses the -axis) using algebraic methods.
Key Terms and Formulas:
-intercept: Set and solve .
-intercept: Set and solve for .
Step-by-Step Guidance
To find -intercepts, set and solve .
Factor or use the quadratic formula to solve for .
To find the -intercept, substitute into and compute .
Try solving on your own before revealing the answer!
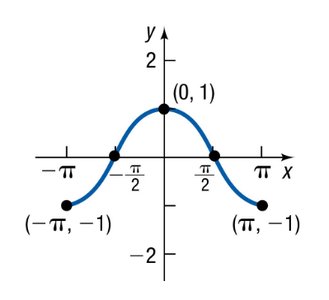
Q5. Identify if the following graph descriptions represent an even, odd, or neither function:
Background
Topic: Symmetry and Parity of Functions
This question tests your understanding of even and odd functions based on their symmetry properties.
Key Terms:
Even function: Symmetric with respect to the -axis ().
Odd function: Symmetric with respect to the origin ().
Step-by-Step Guidance
For the "U-shaped" parabola with vertex at , check if the graph is symmetric about the -axis.
For the line passing through the origin with points and , check if the graph is symmetric about the origin.
Try solving on your own before revealing the answer!
Q6. Test the function algebraically for parity.
Background
Topic: Algebraic Parity Test
This question tests your ability to determine whether a function is even, odd, or neither using algebraic substitution.
Key Terms and Formulas:
Parity test: Substitute with in and compare the result to and .
Step-by-Step Guidance
Replace with in the function: .
Simplify the expression for .
Compare to and to determine parity.
Try solving on your own before revealing the answer!
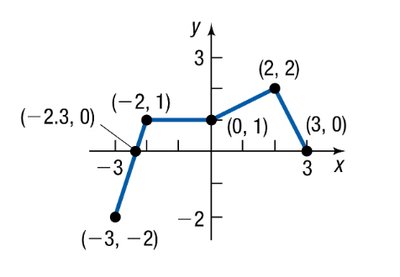
Q7. Using the graph, describe the intervals where is increasing, decreasing, or constant.
Background
Topic: Increasing, Decreasing, and Constant Intervals
This question tests your ability to analyze a graph and identify intervals of monotonicity (where the function goes up, down, or stays flat).
Key Terms:
Increasing interval: gets larger as increases.
Decreasing interval: gets smaller as increases.
Constant interval: stays the same as increases.
Step-by-Step Guidance
Look at the graph and identify segments where the function rises, falls, or remains flat as you move from left to right.
Use the -values to describe each interval.
Try solving on your own before revealing the answer!
Q8. Using the graph from Question 7, identify the local minima and maxima.
Background
Topic: Local Extrema
This question tests your ability to find "peaks" (local maxima) and "valleys" (local minima) on a graph.
Key Terms:
Local maximum: Highest point in a neighborhood.
Local minimum: Lowest point in a neighborhood.
Step-by-Step Guidance
Examine the graph for points where the function changes from increasing to decreasing (local maxima) or decreasing to increasing (local minima).
Identify the -values and corresponding -values for these points.
Try solving on your own before revealing the answer!
Q9. Does the graph in Question 7 have an absolute maximum? If so, what is the highest -value?
Background
Topic: Absolute Extrema
This question tests your ability to identify the highest value a function attains on its entire domain.
Key Terms:
Absolute maximum: The largest -value on the graph.
Step-by-Step Guidance
Scan the graph for the highest point (largest -value).
Record the -value and the corresponding -value.
Try solving on your own before revealing the answer!
Q10. Find the average rate of change for from to .
Background
Topic: Average Rate of Change (AROC)
This question tests your ability to calculate the average rate of change (slope) between two points on a function.
Key Formula:
Average Rate of Change:
Step-by-Step Guidance
Compute and using .
Plug these values into the formula .
Try solving on your own before revealing the answer!
Q11. What is the slope of the secant line containing the points and ?
Background
Topic: Secant Lines
This question tests your understanding of the geometric meaning of average rate of change as the slope of a secant line between two points.
Key Terms:
Secant line: A line connecting two points on a curve.
Slope: between two points.
Step-by-Step Guidance
Recall that the slope of the secant line is the same as the average rate of change calculated in Question 10.
Use the formula .
Try solving on your own before revealing the answer!
Q12. Find the average rate of change for from $1x$.
Background
Topic: Average Rate of Change (Generalized)
This question tests your ability to use the average rate of change formula for a variable interval and simplify the result.
Key Formula:
Average Rate of Change:
Step-by-Step Guidance
Compute for .
Write the expression .
Simplify the numerator by factoring, if possible.
Try solving on your own before revealing the answer!
