 뒤로
뒤로Study Guide: Graphs of Functions and Their Properties (Precalculus Section 2.2)
스터디 가이드 - 스마트 노트
 자료에 맞춘 맞춤형 노트, 핵심 정의, 예시, 맥락을 확장해 제공합니다.
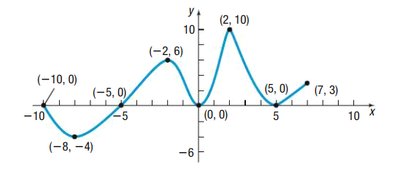
Q1. Use the given graph of the function f to answer parts (a)-(n).
Background
Topic: Graphs of Functions
This question tests your ability to interpret the graph of a function, including evaluating function values, determining domain and range, identifying intercepts, and analyzing the behavior of the function.
Key Terms and Formulas:
Function value: is the y-coordinate for a given x on the graph.
Domain: The set of all x-values for which the function is defined.
Range: The set of all y-values the function attains.
x-intercept: Where the graph crosses the x-axis ().
y-intercept: Where the graph crosses the y-axis ().
Step-by-Step Guidance
To find and , locate and on the graph and read the corresponding y-values.
For and , repeat the process: find these x-values and check the y-coordinates.
To determine if is positive or negative, look at the y-value when ; if it's above the x-axis, it's positive.
For , check the y-value at and decide if it's positive or negative.
To find where , identify all points where the graph crosses the x-axis.
For and , look for intervals where the graph is above or below the x-axis, respectively.
To find the domain and range, observe the leftmost and rightmost x-values and the lowest/highest y-values the graph attains.
For intercepts, check where the graph crosses the axes.
To determine how often or intersects the graph, draw horizontal lines at those y-values and count intersection points.
For or , find the x-values where the graph reaches those y-values.
Try solving on your own before revealing the answer!
Final Answers:
(a) ,
(b) ,
(c) is positive
(d) is negative
(e) at
(f) for in , ,
(g) for in ,
(h) Domain:
(i) Range:
(j) x-intercepts:
(k) y-intercept:
(l) intersects graph 3 times
(m) intersects graph 2 times
(n) at ; at
Each answer is found by carefully reading the graph and applying the definitions of function values, domain, range, and intercepts.
Q2. For , answer the following:
Background
Topic: Rational Functions
This question tests your understanding of rational functions, including evaluating function values, finding domain, and identifying intercepts.
Key Terms and Formulas:
Rational function: A function of the form where and are polynomials.
Domain: All real numbers except where the denominator is zero.
x-intercept: Set numerator equal to zero and solve for .
y-intercept: Evaluate .
Step-by-Step Guidance
To check if is on the graph, substitute into and see if .
For , plug into to find the y-value, then write the point .
If , set and solve for .
To find the domain, set the denominator and solve for excluded values.
For x-intercepts, set and solve for .
For y-intercept, substitute into .
Try solving on your own before revealing the answer!
Final Answers:
(a) No, is not on the graph since
(b) , so the point is
(c) leads to , so is on the graph
(d) Domain: All real numbers except
(e) x-intercept:
(f) y-intercept:
These answers use substitution and algebraic manipulation to analyze the rational function.
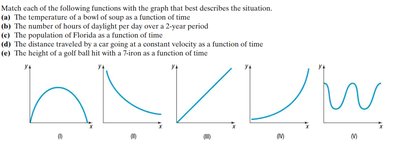
Q3. Match each function description to the graph that best describes the situation.
Background
Topic: Real-World Applications of Functions
This question tests your ability to interpret graphs in context and match them to real-world scenarios.
Key Terms and Formulas:
Function of time: How a quantity changes as time progresses.
Graph shape: The visual pattern of the graph (increasing, decreasing, periodic, etc.)
Step-by-Step Guidance
Analyze each graph's shape: Is it increasing, decreasing, periodic, or does it have peaks and valleys?
Consider the real-world scenario: For example, temperature of soup cools down, so look for a decreasing curve.
For daylight hours, expect a periodic graph (repeats over time).
Population of Florida likely increases over time, so look for an upward trend.
Distance at constant velocity should be a straight line.
Height of a golf ball with a 7-iron will rise and fall, possibly multiple times.
Try solving on your own before revealing the answer!
Final Answers:
(a) Temperature of soup: Graph (B)
(b) Hours of daylight: Graph (E)
(c) Population of Florida: Graph (D)
(d) Distance at constant velocity: Graph (C)
(e) Height of golf ball: Graph (A)
Each match is based on the expected behavior of the quantity over time.
