뒤로
뒤로Study Notes: More on Functions and Their Graphs
스터디 가이드 - 스마트 노트
 자료에 맞춘 맞춤형 노트, 핵심 정의, 예시, 맥락을 확장해 제공합니다.
2.2 More on Functions and Their Graphs
2.2.1 Increasing, Decreasing, and Constant Functions
Understanding how a function behaves as its input changes is fundamental in precalculus. Functions can be classified as increasing, decreasing, or constant over specific intervals.
Increasing Function: A function f is increasing on an interval I if for any x_1, x_2 \in I with x_1 < x_2, we have f(x_1) < f(x_2). Graphically, the curve rises as you move from left to right.
Decreasing Function: A function f is decreasing on an interval I if for any x_1, x_2 \in I with x_1 < x_2, we have f(x_1) > f(x_2). The graph falls as you move from left to right.
Constant Function: A function f is constant on an interval I if for all x_1, x_2 \in I, f(x_1) = f(x_2). The graph is a horizontal line.
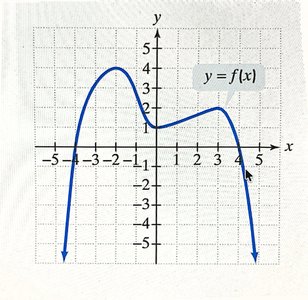
Example: Consider the graph below. Identify intervals where the function is increasing, decreasing, or constant.
2.2.2 Relative Maxima and Relative Minima
Relative extrema are points where a function reaches a local highest or lowest value within a certain interval.
Relative Maximum: A function value f(a) is a relative maximum if there exists an open interval around a such that f(a) > f(x) for all x near a. This is the top of a hill on the graph.
Relative Minimum: A function value f(b) is a relative minimum if there exists an open interval around b such that f(b) < f(x) for all x near b. This is the bottom of a valley on the graph.
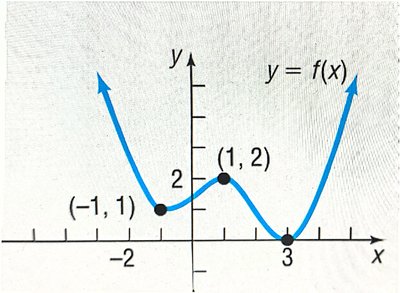
Example: Use the graph below to answer:
At which x-values does f have a relative maximum?
What is the relative maximum value?
Find all relative minima as ordered pairs.
Determine intervals where the function is increasing, decreasing, or constant.
2.2.3 Even and Odd Functions
Functions can exhibit symmetry, which helps in graphing and understanding their properties.
Even Function: A function f is even if f(-x) = f(x) for all x in the domain. The graph is symmetric about the y-axis.
Odd Function: A function f is odd if f(-x) = -f(x) for all x in the domain. The graph is symmetric about the origin.
Example: The absolute value function f(x) = |x| is even, while f(x) = x^3 is odd.
2.2.4 Piecewise Functions
A piecewise function is defined by different expressions over different intervals of the domain.
Definition: A function f(x) is piecewise if it is defined by multiple rules for different parts of its domain.
Example:
Interval | Expression |
|---|---|
0 ≤ x ≤ 15 | 40 |
x > 15 | 40 + 0.60(x - 15) |
Find f(5) and f(50):
f(5): Since 0 ≤ 5 ≤ 15, f(5) = 40.
f(50): Since 50 > 15, f(50) = 40 + 0.60(50 - 15) = 40 + 0.60 \times 35 = 40 + 21 = 61.
Graphing Piecewise Functions: Graph each piece over its interval, using open or closed circles to indicate whether endpoints are included.
2.2.5 Difference Quotient
The difference quotient is a fundamental concept for understanding rates of change and the foundation of calculus.
Definition: For a function f, the difference quotient is:
Example 1: If f(x) = 3x + 7, find and simplify the difference quotient.
Example 2: If f(x) = x^2 - 3x + 2, find and simplify the difference quotient.
2.2.6 Graph Analysis Exercise
Study the graph below and answer the following:
Is the function even, odd, or neither?
What is the domain and range?
Find the x-intercept(s) and y-intercept.
Identify intervals where the function is increasing, decreasing, or constant.
Find numbers at which the function has relative maxima and minima.
For which x-values is f(x) = 3?