2. Describing Data with Tables and Graphs / Frequency Polygons / 문제 1
문제 1
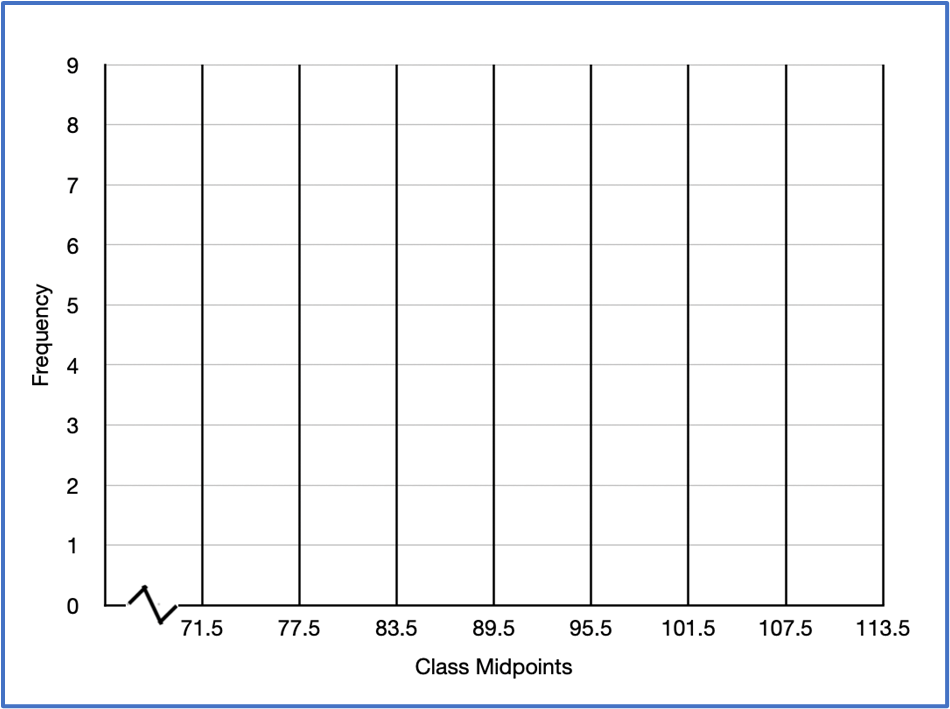
The numbers below represent daily customer counts from a sample of coffee shops. Data set: , , , , , , , , , , , , , , , , , , , , , , , , , , , , , , Construct a frequency distribution for the data set using six classes. Draw a frequency polygon for the frequency distribution.