2. Describing Data with Tables and Graphs / Histograms / 문제 6
문제 6
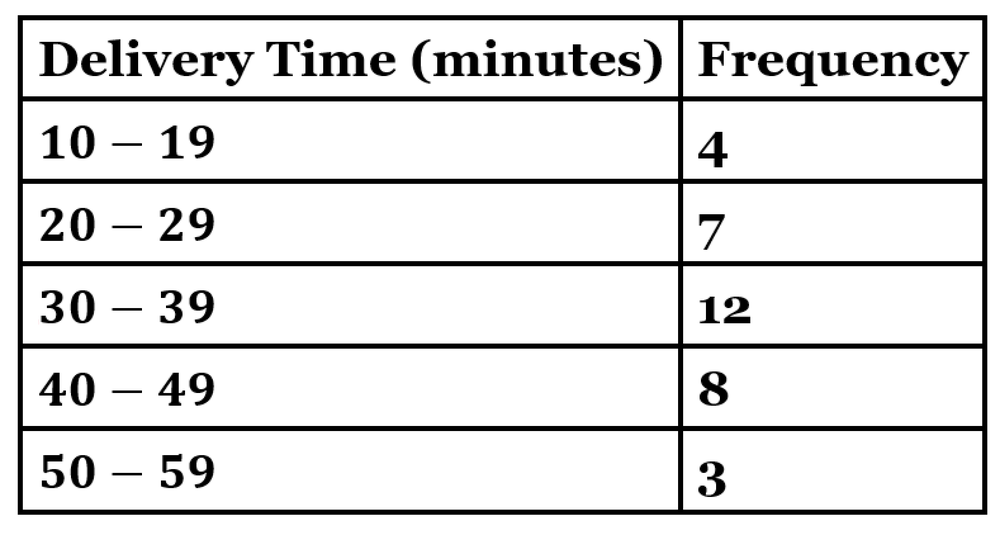
The following frequency distribution represents the delivery times (in minutes) for packages shipped from a logistics center. Construct the histogram corresponding to this frequency distribution. Which of these best describes the distribution: uniform, normal, skewed left, or skewed right?