 뒤로
뒤로Chapter 1: Data Collection – Foundations of Statistics
스터디 가이드 - 스마트 노트
 자료에 맞춘 맞춤형 노트, 핵심 정의, 예시, 맥락을 확장해 제공합니다.
Data Collection
Introduction to Data
Data are collections of observations, such as measurements (numbers), categories (like gender), or survey responses. Data are essential for drawing conclusions and making decisions in statistics. They can be numerical (e.g., height) or nonnumerical (e.g., hair color), but in all cases, data describe characteristics of individuals. A key aspect of data is that they vary among individuals.
Types of Variables
Variables are characteristics of individuals that are measured, recorded, and analyzed. Variables can be classified as either qualitative or quantitative:
Qualitative (Categorical) Variables: Allow for classification based on attributes or characteristics. Examples include nationality, model of car, or zip code.
Quantitative Variables: Provide numerical measures of individuals. Arithmetic operations such as addition and subtraction are meaningful. Examples include number of children, household income, or daily intake of whole grains.
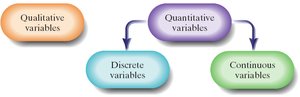
Subtypes of Quantitative Variables
Discrete Variables: Quantitative variables with a finite or countable number of possible values (e.g., number of children, points scored in a game).
Continuous Variables: Quantitative variables with an infinite number of possible values within an interval (e.g., time, income, daily intake measured in grams).
If you count to get the value, it is discrete; if you measure, it is continuous.
Statistics: The Science of Data
Statistics is the science of planning studies and experiments, obtaining data, and then organizing, summarizing, presenting, analyzing, interpreting, and drawing conclusions based on the data.
Distinguishing Between Variables and Data
Individuals, Variables, and Data
In a dataset, the individuals are the entities being studied (e.g., cars, countries, people). Variables are the characteristics measured for each individual, and data are the observed values for these variables.

Example: Country Data Table
Country | Government Type | Life Expectancy (years) | Population (in millions) |
|---|---|---|---|
Australia | Federal parliamentary democracy | 81.81 | 21.8 |
Canada | Constitutional monarchy | 81.38 | 34.0 |
France | Republic | 81.19 | 65.3 |
Morocco | Constitutional monarchy | 75.90 | 32.0 |
Poland | Republic | 76.05 | 38.4 |
Sri Lanka | Republic | 75.73 | 21.3 |
United States | Federal republic | 78.37 | 313.2 |
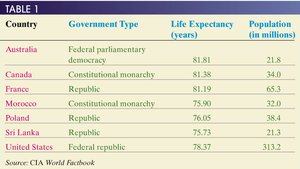
In this table, the individuals are the countries, the variables are government type, life expectancy, and population, and the data are the specific values listed for each country.
Example: Parking Meter Data Table
Car | Payment Method | Amount Paid | Duration (in minutes) | Side of Street | Parking Space Number |
|---|---|---|---|---|---|
1 | Credit Card | $3.75 | 30 | W | 458 |
2 | Credit Card | $2.00 | 240 | E | 37 |
3 | Credit Card | $2.00 | 240 | NE | 18 |
4 | Phone | $1.38 | 225 | SW | 382 |
5 | Credit Card | $0.95 | 60 | W | 770 |
6 | Credit Card | $0.25 | 10 | E | 75 |
7 | Credit Card | $0.75 | 120 | S | 136 |
8 | Phone | $0.90 | 20 | S | 62 |
9 | Phone | $0.50 | 20 | S | 49 |
10 | Phone | $0.50 | 30 | S | 42 |
11 | Phone | $1.71 | 204 | SW | 382 |
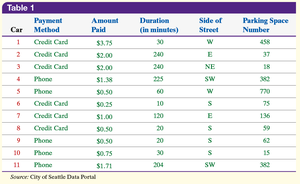
Here, the individuals are the cars, the variables include payment method, amount paid, duration, side of street, and parking space number, and the data are the observed values for each car.
Populations, Samples, and Individuals
Definitions
Population: The entire group of individuals to be studied (e.g., all students at a college, all US households).
Sample: A subset of the population that is actually studied.
Individual: A single member of the population or sample.
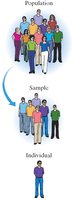
For example, if you survey 40 students out of all students at a college, the 40 students are the sample, and each student is an individual.
Descriptive and Inferential Statistics
Descriptive Statistics
Descriptive statistics involve organizing and summarizing data using numerical summaries, tables, and graphs. They describe the sample or population without making generalizations beyond the data at hand.
Inferential Statistics
Inferential statistics use methods that take results from a sample, extend them to the population, and measure the reliability of the result. For example, using a sample proportion to estimate a population proportion with a confidence interval.
Parameters and Statistics
Definitions
Parameter: A numerical summary of a population (e.g., the percentage of all students who own a car).
Statistic: A numerical summary of a sample (e.g., the percentage of surveyed students who own a car).
Parameters describe populations; statistics describe samples.
Examples
If 48.2% of all students own a car, 48.2% is a parameter.
If 46% of a sample of 100 students have a job, 46% is a statistic.
Matching Key Terms and Definitions
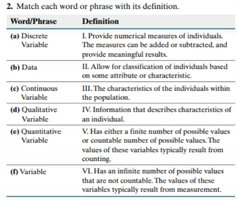
Word/Phrase | Definition |
|---|---|
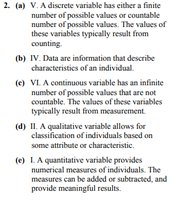
Discrete Variable | Has either a finite number of possible values or countable number of possible values. The values of these variables typically result from counting. |
Data | Information that describes characteristics of an individual. |
Continuous Variable | Has an infinite number of possible values that are not countable. The values of these variables typically result from measurement. |
Qualitative Variable | Allows for classification of individuals based on some attribute or characteristic. |
Quantitative Variable | Provides numerical measures of individuals. The measures can be added or subtracted, and provide meaningful results. |
Variable | The characteristics of the individuals within the population. |
Practice: Parameters vs. Statistics
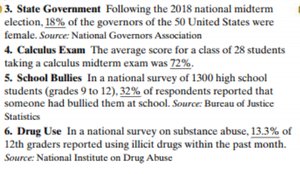
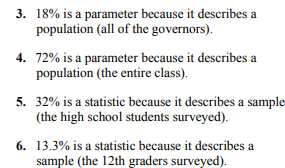
18% of governors are female: Parameter (describes a population).
72% average score for a class: Parameter (describes a population).
32% of surveyed high school students bullied: Statistic (describes a sample).
13.3% of surveyed 12th graders used drugs: Statistic (describes a sample).
Summary Table: Types of Variables
Type | Description | Examples |
|---|---|---|
Qualitative | Describes categories or attributes | Gender, nationality, car model |
Quantitative (Discrete) | Countable numerical values | Number of children, points scored |
Quantitative (Continuous) | Measurable numerical values | Height, income, time |
Key Formulas:
Sample Mean:
Population Mean:
Sample Proportion:
Population Proportion:
