 뒤로
뒤로Chapter 1: Introduction to Data and Statistics
스터디 가이드 - 스마트 노트
 자료에 맞춘 맞춤형 노트, 핵심 정의, 예시, 맥락을 확장해 제공합니다.
Chapter 1: Introduction to Data
Section 1.1: What are Data?
Statistics is a foundational discipline for understanding and interpreting data in various fields. This section introduces the concept of data and the science of statistics, emphasizing its importance in decision-making and research.
Definition of Statistics: Statistics is the science of collecting, organizing, summarizing, and analyzing data to answer questions and/or draw conclusions.
Importance of Statistics: Statistics helps us make informed decisions, understand trends, and draw conclusions from data. It is used in fields such as medicine, politics, business, and social sciences.
Two Major Concepts:
Variation: Refers to differences or changes in an item or between items.
Data: Observations gathered to draw conclusions. Data must always be interpreted within context.
Statistics in the News: News articles often use statistics to report trends and public opinion, such as polls and surveys.


Section 1.2: Classifying and Storing Data
Understanding the source and type of data is essential for proper analysis. This section covers the distinction between populations and samples, and the classification of variables.
Data Sources:
Population: The complete set of all data values of interest. Often difficult to obtain.
Sample: A subset of the population, used to represent the population. Easier to obtain.
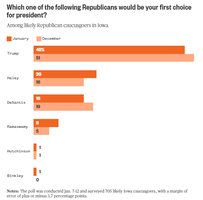
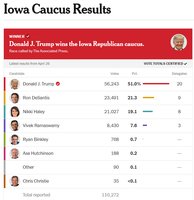
Example: Iowa Caucus 2024: Election results can be based on either a sample (polls) or the population (actual votes).
Classifying Data:
Variable: A characteristic of people or things.
Types of Variables:
Categorical: Describes a quality or class (e.g., gender, color, political party). Arithmetic operations are not meaningful.
Numerical: Describes a quantity or measurement (e.g., height, age, number of votes).
Example: Crime Statistics (2024): Variables in crime data may include city (categorical), number of offenses (numerical), and type of crime (categorical).
Section 1.3: Investigating Data
Investigating data involves asking questions and considering the context and variables involved. This process is essential for meaningful analysis and interpretation.
Asking Questions: Formulate questions that can be answered using the available data.
Considering Data: Identify what information is available and what additional data may be needed.
Example: "What is the relationship between crime rate and city population?"
Section 1.4: Organizing Categorical Data
Organizing categorical data allows for easier interpretation and comparison. This section discusses methods for summarizing and analyzing categorical variables.
Organizing Data: Use tables and charts to summarize categorical data, such as identifying the most dangerous state based on crime rates.
Incomplete Data: Sometimes data may be missing or incomplete, requiring careful interpretation.
Example: Dangerous Sports: Injury Rate is calculated as:
Two-Way Tables: Used to summarize relationships between two categorical variables. For example, survey responses by gender and opinion.
Example Two-Way Table:
Strongly Agree | Agree | Disagree | |
|---|---|---|---|
Male | 120 | 300 | 180 |
Female | 150 | 350 | 200 |
Total | 270 | 650 | 380 |
Additional info: Table values are inferred for illustration.
Questions from Two-Way Tables:
What percentage of respondents strongly agreed?
What percentage of female respondents strongly agreed?
What percentage of male respondents strongly agreed?
Section 1.5: Collecting Data to Understand Causality
Establishing causality is a central goal in many statistical studies. This section explains how causality is investigated and the types of studies used.
Causality: Determining whether one variable (treatment) causes a change in another variable (response).
Types of Studies:
Anecdotal Evidence: Based on individual stories; not reliable for establishing causality.
Observational Study: Subjects choose their group; can show association but not causality.
Experiment: Researcher assigns subjects to groups; can establish causality.
Elements of a Study:
Treatment Group: Receives the treatment or has the characteristic of interest.
Comparison (Control) Group: Does not receive the treatment.
Placebo: Harmless treatment given instead of the actual treatment.
Placebo Effect: Participants react to a treatment simply because they believe they are receiving it.
Gold Standards of Experiments:
Large Sample Size: Reduces random error.
Random Assignment: Subjects are randomly assigned to groups to minimize bias.
Blinding:
Single-Blind: Participants do not know their group assignment.
Double-Blind: Neither participants nor researchers know group assignments.
Example: "Do vaccines cause autism?" Only a well-designed experiment can establish causality, not anecdotal evidence or observational studies.
