 뒤로
뒤로Chapter 3: Probability – Structured Study Notes for Statistics Students
스터디 가이드 - 스마트 노트
 자료에 맞춘 맞춤형 노트, 핵심 정의, 예시, 맥락을 확장해 제공합니다.
Probability
Basic Concepts of Probability and Counting
Probability is a fundamental concept in statistics that quantifies the likelihood of events occurring in a random experiment. Understanding probability involves identifying the sample space, events, and outcomes, and applying counting principles to determine possible results.
Probability Experiment: An action or trial that produces specific results (counts, measurements, or responses).
Outcome: The result of a single trial in a probability experiment.
Sample Space: The set of all possible outcomes of a probability experiment.
Event: A subset of the sample space, consisting of one or more outcomes.
Examples of Probability Experiments
Basketball Shot: Outcomes are 0, 1, 2, or 3 points.
Traffic Light: Outcomes are green, yellow, or red.
Identifying the Sample Space
For a survey asking blood types (O, A, B, AB) and Rh factor (positive or negative), the sample space consists of eight possible outcomes, which can be visualized using a tree diagram.
Simple Events
A simple event is an event that consists of a single outcome. If an event includes more than one outcome, it is not simple.
Example: Selecting a specific defective machine part is a simple event (only one outcome).
Example: Rolling at least a 4 on a six-sided die is not a simple event (three outcomes: 4, 5, 6).
Counting Skills and the Fundamental Counting Principle
Tree diagrams are useful for listing outcomes when possibilities are few, but for larger sets, the Fundamental Counting Principle is used to efficiently determine the number of possible outcomes.
Fundamental Counting Principle: If one event can occur in m ways and another in n ways, the two events together can occur in m × n ways.
Example: Car Selection
Three manufacturers, two car sizes, four colors: Total ways = 3 × 2 × 4 = 24.
Example: Access Codes
Four digits, each 0–9, no repetition: 10 × 9 × 8 × 7 = 5040 possible codes.
With repetition: 10 × 10 × 10 × 10 = 10,000 possible codes.
First digit not 0 or 1: 8 × 10 × 10 × 10 = 8,000 possible codes.
Example: License Plates in Ohio
Three letters (A–Z), four digits (0–9), no repetition: 26 × 25 × 24 × 10 × 9 × 8 × 7 = 175,760,000 possible plates.

Types of Probability
Probability can be classified into three main types: classical, empirical, and subjective.
Classical (Theoretical) Probability: Each outcome in the sample space is equally likely. Formula: where n(E) is the number of outcomes in event E, and n(S) is the number of outcomes in the sample space.
Empirical (Statistical) Probability: Based on observed data from experiments. Formula: where f is the frequency of the event, and n is the total number of trials.
Subjective Probability: Based on intuition, educated guesses, or estimates.
Example: Finding Classical Probabilities
Rolling a 3 on a six-sided die:
Rolling a number less than 5:
Example: Finding Empirical Probabilities
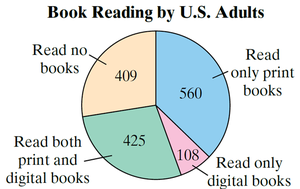
Survey of U.S. adults reading books: Probability that the next adult read only print books =
Law of Large Numbers
The law of large numbers states that as a probability experiment is repeated many times, the empirical probability approaches the theoretical probability.
Subjective Probability Examples
A doctor estimates a 90% chance of recovery.
A sports analyst predicts a 70% chance of winning.
An investor estimates a 40% chance of market rise.
Range of Probabilities Rule
The probability of any event E is between 0 and 1, inclusive. This range can be interpreted as follows:
0: Impossible
0.25: Unlikely
0.5: Even chance
0.75: Likely
1: Certain

Complementary Events
The complement of event E is the set of all outcomes in the sample space not included in E. The probability of the complement is:
Formula:
Example: Probability of the Complement
If 765 out of 3000 users are 25–34 years old, then the probability that a randomly selected user is not 25–34 years old is
Using the Fundamental Counting Principle: Social Security Numbers
A Social Security Number (SSN) consists of nine digits, each from 0 to 9, and digits can be repeated. The total number of possible SSNs is:
Formula: possible SSNs.
Probability of randomly generating your SSN:

Summary Table: Types of Probability
Type | Definition | Example |
|---|---|---|
Classical | Equally likely outcomes | Rolling a die |
Empirical | Based on observed data | Survey results |
Subjective | Based on intuition/estimate | Expert opinion |
Key Formulas
Classical Probability:
Empirical Probability:
Complement:
Additional info: Academic context and examples were expanded for clarity and completeness. All images included are directly relevant to the adjacent explanations.
