 뒤로
뒤로Correlation and Scatterplots: Understanding Relationships Between Variables
스터디 가이드 - 스마트 노트
 자료에 맞춘 맞춤형 노트, 핵심 정의, 예시, 맥락을 확장해 제공합니다.
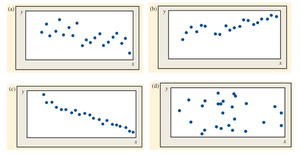
Q3. Match the scatterplots below with the correlation values: R = -0.9, R = 0, R = -0.5, and R = 0.6
Background
Topic: Correlation and Scatterplots
This question tests your ability to visually interpret scatterplots and match them to the correct correlation coefficient. Correlation measures the strength and direction of a linear relationship between two variables.
Key Terms and Formulas
Correlation coefficient (r): A value between -1 and 1 that describes the strength and direction of a linear relationship.
Scatterplot: A graph that shows the relationship between two quantitative variables.
Positive correlation: As one variable increases, the other tends to increase (r > 0).
Negative correlation: As one variable increases, the other tends to decrease (r < 0).
No correlation: No clear linear relationship (r ≈ 0).
Step-by-Step Guidance
Examine each scatterplot and look for the overall pattern: upward slope, downward slope, or no clear pattern.
Recall that a strong positive correlation (r close to 1) will show points closely clustered along an upward-sloping line. A strong negative correlation (r close to -1) will show points closely clustered along a downward-sloping line. No correlation (r ≈ 0) will show points scattered randomly.
Compare the scatterplots to the correlation values given: R = -0.9 (strong negative), R = 0 (no correlation), R = -0.5 (moderate negative), R = 0.6 (moderate positive).
Try to match each plot to the description: Which plot shows a strong downward trend? Which plot shows a moderate upward trend? Which plot shows no trend?
Try solving on your own before revealing the answer!
Final Answer:
(a) R = -0.5; (b) R = 0.6; (c) R = -0.9; (d) R = 0
Each scatterplot visually represents the strength and direction of the correlation. The strongest negative correlation is (c), the moderate positive is (b), the moderate negative is (a), and no correlation is (d).
