 뒤로
뒤로Data Types and Levels of Measurement in Introductory Statistics
스터디 가이드 - 스마트 노트
 자료에 맞춘 맞춤형 노트, 핵심 정의, 예시, 맥락을 확장해 제공합니다.
Section 2.1: Data Types and Levels of Measurement
Overview
This section introduces fundamental concepts in statistics regarding the classification of data. Understanding data types and levels of measurement is essential for selecting appropriate statistical methods and interpreting results accurately.
Data Types
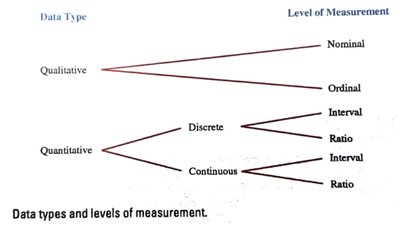
Data in statistics can be broadly classified into two main types: qualitative and quantitative.
Qualitative (Categorical) Data: Values that can be placed into nonnumerical categories or numerical categories where the numbers do not represent counts or measurements. Examples include colors, brands, or types.
Quantitative Data: Values that represent counts or measurements. These are numerical and can be further analyzed mathematically. Examples include height, weight, or number of items.
Subtypes of Quantitative Data
Quantitative data can be further divided into discrete and continuous types:
Discrete Data: Data that can only take particular, distinct values (often obtained by counting). For example, the number of students in a class.
Continuous Data: Data that can take any value within a given interval (obtained by measuring). For example, the time taken to complete a race.
Levels of Measurement
Data can also be classified by its level of measurement, which determines the types of statistical analysis that are appropriate:
Nominal: Data consisting of names, labels, or categories only. The data are qualitative and cannot be ranked or ordered. Example: Types of fruit.
Ordinal: Qualitative data that can be arranged in some order (such as low to high), but computations are not meaningful. Example: Star ratings (excellent, good, fair, poor).
Interval: Quantitative data for which intervals are meaningful, but ratios are not. The zero point is arbitrary. Example: Temperature in Celsius or Fahrenheit.
Ratio: Quantitative data for which both intervals and ratios are meaningful. The data have a true zero point. Example: Distance, weight, or time.
Summary Table: Data Types and Levels of Measurement
The following table summarizes the relationships between data types and levels of measurement:
Data Type | Subtype | Level of Measurement | Description |
|---|---|---|---|
Qualitative | - | Nominal | Names, labels, categories; no order |
Qualitative | - | Ordinal | Ordered categories; no meaningful computation |
Quantitative | Discrete | Interval | Meaningful intervals; arbitrary zero |
Quantitative | Discrete | Ratio | Meaningful intervals and ratios; true zero |
Quantitative | Continuous | Interval | Meaningful intervals; arbitrary zero |
Quantitative | Continuous | Ratio | Meaningful intervals and ratios; true zero |
Examples and Applications
Qualitative vs Quantitative:
Brand names of running shoes: Qualitative
Scores on a multiple-choice exam: Quantitative
Letter grades on an essay assignment: Qualitative
Numbers on uniforms that identify players: Qualitative (since the numbers are identifiers, not measurements)
Discrete vs Continuous:
Time to walk a mile: Continuous (measured)
Calendar years: Discrete (counted)
Number of dairy cows: Discrete (counted)
Amount of milk produced: Continuous (measured)
Levels of Measurement:
Numbers on uniforms: Nominal
Student rankings of cafeteria food: Ordinal
Calendar years of historic events: Interval
Temperatures on the Celsius scale: Interval
Runners’ times in a marathon: Ratio
Key Formulas and Concepts
Interval Data: Differences are meaningful, but ratios are not. Example:
Ratio Data: Both differences and ratios are meaningful. Example: (twice as far)
Additional info: Interval and ratio data are always quantitative and can be either discrete or continuous, depending on whether the values are counted or measured.
