 뒤로
뒤로Exploring One-Variable Data & Collecting Data: Foundations of Statistics
스터디 가이드 - 스마트 노트
 자료에 맞춘 맞춤형 노트, 핵심 정의, 예시, 맥락을 확장해 제공합니다.
Unit 1: Exploring One-Variable Data & Collecting Data
Introducing Statistics: What Can We Learn from Data?
Statistics is the science of collecting, analyzing, interpreting, and presenting data to answer questions or make decisions. Data are observations that have been measured, recorded, collected, analyzed, and reported for use. Data contains information about a group of individuals: objects described by a set of data. The information is organized using variables.
What Is a Statistical Study?
A statistical study is a study in which data are collected from a sample to answer an investigative question about a larger population. The sample is the smaller group from which data are actually collected, and its size is represented by the variable n. A statistic is a value that describes a sample. The population is the entire group of interest, with size represented by N. A parameter is a value that describes a population, usually estimated from a statistic.
Why sample? The population might be too large, too time-consuming, or too expensive to measure every individual.
Example: Surveying every high school student in the United States is impractical, so we use a sample to estimate population characteristics.
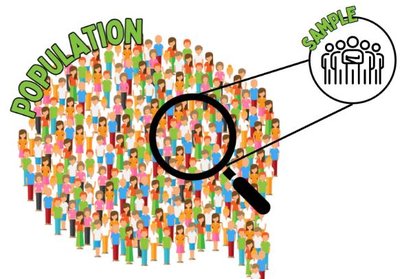
Key Terms: Population, Sample, Statistic, Parameter
Population: The entire group you are interested in learning about (size = N).
Sample: The group you actually collect data from (size = n).
Parameter: A value that describes a population (often unknown, estimated from a statistic).
Statistic: A value that describes a sample.
Example 1: The average height for a 15-year-old female at our high school is 5’4” (parameter). A sample of 10 females at our school have an average height of 5’7” (statistic).
Example 2: High school students in your county work an average of 18 hours per week (parameter). A sample of 50 high school students in the county revealed that they worked an average of 23 hours per week (statistic).
Datum vs. Data
Datum: A single piece of information or one value collected from an observational unit. Example: 92 – one student's test score.
Data: A collection of data values (the plural of datum). Example: 92, 85, 78, 90 – all students' test scores.
Observational Unit: An item or individual from which a datum is collected. Example: Each student in a test; datum is a single test score.
Investigative Questions
An investigative question should have a clearly defined population, be decided before data collection, not change based on the data, identify the variable being measured, and be answerable with data.
Good Investigative Question: "What is the average number of hours of sleep per night for the 12th grade students at North High School?" (Identifies population & variable, clear and measurable)
Bad Investigative Question: "Do teens sleep enough?" (Vague, no measurable variable)
What Does “In Context” Mean?
Each number, statistic, or result must be tied back to the real-world situation it came from.
"In context" means relating each statistical result to its real meaning in the study. Example: "The mean number of hours of sleep for the sample of seniors is 6.2 hours."
Types of Variables
A variable is a characteristic that may change from one observational unit to another. There are two main types of variables: categorical and quantitative.
Categorical Variables: Data that places individuals into specific groups (also called "qualitative" variables). Examples: Gender, eye color, type of car, grade level, favorite subject.
Quantitative Variables: Data that takes on numerical values, where performing arithmetic operations makes sense (also called "numerical" variables). These can be broken down into two types:
Discrete Variables: Numerical data where whole numbers make sense (counted, not measured). Examples: Number of siblings, number of pets, number of books read.
Continuous Variables: Numerical data where decimals make sense (measured, not counted). Examples: Height, weight, time spent on homework.
Note: Not all numbers are quantitative. For example, a jersey number is a number but is categorical. The distinction between discrete and continuous can depend on context; for example, age can be treated as discrete or continuous depending on how it is measured and reported.
Putting It All Together: Example Scenario
Scenario: A school wants to know how much time students spend on homework each night. A random sample of 75 students at the school was taken and asked how many minutes they spend on homework each night. They found that students spent an average of 96 minutes on homework each night.
Population: All students at the school.
N represents: The total number of students at the school.
Sample: The 75 students surveyed.
n = 75
Variable being measured: Number of minutes spent on homework each night.
Type of variable: Quantitative, continuous.
Investigative question: "What is the average number of minutes students at this school spend on homework each night?"
Result in context: The sample of 75 students spent an average of 96 minutes on homework each night, which estimates the average for all students at the school.
