 뒤로
뒤로Introduction to Statistics: Data, Variables, and Randomness
스터디 가이드 - 스마트 노트
 자료에 맞춘 맞춤형 노트, 핵심 정의, 예시, 맥락을 확장해 제공합니다.
Chapter 1: Introduction to Statistics
What Is Statistics?
Statistics is both a collection of numerical data and a scientific discipline focused on reasoning with data. It involves methods and tools for collecting, analyzing, interpreting, and presenting data to understand variation and make informed decisions in the presence of uncertainty.
Statistics (noun): Numbers, values, data, and calculations derived from data.
Statistics (verb): The process of reasoning with data using systematic methods and tools.
Key Focus: Measuring, understanding, and adapting to variation; making decisions with incomplete information.
Example: Calculating the average height of students in a class is a statistical activity. Using that average to make inferences about all students at a university is statistical reasoning.
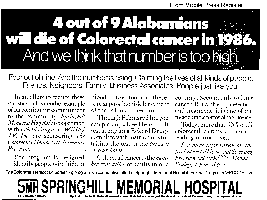
Data
What Are Data?
Data are pieces of information collected for analysis. They can be numbers, characters, images, or other labels. The meaning of data depends on their context, which includes information about how, when, where, and why the data were collected.
Numerical Data: Numbers that represent measurable quantities (e.g., height in inches).
Categorical Data: Labels or names used to identify categories (e.g., gender, zip code).
Context: Data are meaningful only when their context is known (who, what, when, where, why, and how).
Example: The number "1" could mean "male" in a gender variable or "one sibling" in a family survey, depending on context.
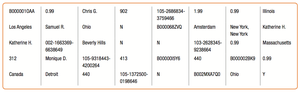
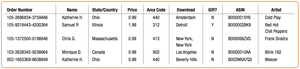
Real Data Can Be “Messy”
Data collected from real-world sources often contain inconsistencies, missing values, or ambiguous responses. Careful planning and clear definitions are essential for meaningful data collection.
Different units of measure
Ambiguous or poorly worded questions
Non-response or missing data
Outliers or seemingly "ridiculous" responses
Example: Asking "How tall are you?" without specifying units may lead to answers in inches, centimeters, or feet.
Sample and Population
Statistics often aims to make inferences about a population (the entire group of interest) using a sample (a subset of the population). The sample should be representative to ensure valid conclusions.
Population: The complete set of individuals or items of interest.
Sample: A subset of the population, selected for analysis.
Randomness: Random selection helps ensure the sample represents the population.
Example: Surveying 100 students from a university to estimate the average study time for all students.
The “W’s” of Data
To provide context, always consider the "W's":
Who: The individuals or cases being measured
What: The variables being measured (and their units)
When, Where, Why, How: Additional context for understanding the data

Variables
Types of Variables
Variables are characteristics or properties that can take on different values. They are classified as either categorical or quantitative:
Categorical (Qualitative) Variables: Describe qualities or categories (e.g., gender, eye color, zip code).
Quantitative Variables: Represent numerical values with meaningful units (e.g., height in inches, income in dollars).
Special Types of Categorical Variables:
Ordinal Data: Categorical data with a natural order (e.g., class rank: freshman, sophomore, junior, senior).
Identifier Data: Unique values for each observation (e.g., Social Security Number, ISBN).
Example: Shoe size is quantitative; favorite coffee flavor is categorical.
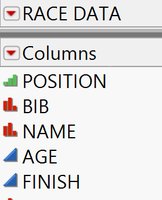
Identifying Identifiers
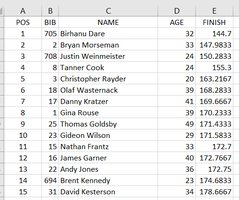
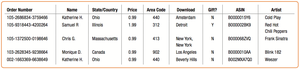
Identifier variables are categorical variables with unique values for each observation. They are not summarized graphically or numerically but are used to distinguish records.
Examples: Social Security Number, ISBN, tracking numbers
Purpose: To uniquely identify each case in a dataset
Types of Data Exercises
Practice classifying variables as categorical or quantitative:
Gender: Categorical
Number of siblings: Quantitative
Number of countries ever visited: Quantitative
Height: Quantitative
Favorite Starbucks flavor: Categorical
Shoe size: Quantitative
Randomness
What Are “Random Events”?
Random events are outcomes that are unpredictable in individual cases but may follow predictable patterns in the long run. Events are considered random if knowing the outcome of one event does not provide information about the next (independence).
Random events are not always equally likely.
Randomness is a tool for selecting representative samples and simulating real-world processes.
Example: Flipping a fair coin is a random event; each flip is independent of the previous one.
Why Be Random?
Randomness is essential in statistics for:
Selecting representative samples from populations
Simulating complex or unpredictable real-world phenomena
Example: Using a random number generator to select survey participants.
Simulations
Simulations use random numbers to mimic real-world processes, especially when exact answers are too complex or impossible to determine analytically.
Modeling job creation due to economic changes
Studying the impact of weather on aircraft landings
Creating virtual reality environments
Formula Example: Probability of an event is given by:
