 뒤로
뒤로Introduction to Statistics: Gathering and Classifying Data
스터디 가이드 - 스마트 노트
 자료에 맞춘 맞춤형 노트, 핵심 정의, 예시, 맥락을 확장해 제공합니다.
Introduction to Statistics and Collecting Data
Research Objectives and Data Collection
Statistics begins with the process of posing a question, known as the research objective. Data collection is essential for making informed decisions, whether in social concerns, business, government, or consumer contexts. The research objective is often composed of several related questions, each of which can be addressed by gathering relevant data.
Research Objective: The main question guiding the data collection process.
Variables: Characteristics of interest measured for individuals in a population.
Data: The information obtained from measuring variables; can be qualitative (categorical) or quantitative (numerical).
Example: Deciding which college to transfer to involves collecting data on enrollment, housing, degree programs, tuition, class size, and location.
Types of Variables
Variables are classified based on the type of data they yield. Understanding the distinction between qualitative and quantitative variables is fundamental in statistics.
Qualitative (Categorical) Variables: Yield data in the form of word responses or categories (e.g., "yes" or "no").
Quantitative (Numerical) Variables: Yield data in the form of numbers (e.g., "5050 students").
Classification Example:
Q1. Number of students: Quantitative
Q2. On-campus housing: Qualitative
Q3. Degree program availability: Qualitative
Q4. Tuition cost: Quantitative
Q5. Class size: Quantitative
Q6. College location: Qualitative
Describing Data: Classification of Variables
Quantitative Variables: Discrete vs. Continuous
Quantitative variables can be further classified as discrete or continuous based on how their values are obtained.
Discrete Variables: Values are counted and come from a finite list of possibilities (e.g., number of classes taken).
Continuous Variables: Values are measured and come from an infinite set of possibilities (e.g., time taken to log in).
Example:
Q1. Number of students: Discrete
Q4. Tuition cost: Continuous
Q5. Class size: Discrete
Qualitative Variables: Nominal vs. Ordinal
Qualitative variables are classified based on whether their categories have a natural order.
Nominal Variables: Categories have no natural order (e.g., major, ZIP code).
Ordinal Variables: Categories have a natural order (e.g., class year, course rating).
Summary Table: Classification of Variables
The following table summarizes the classification of variables based on their properties:
Variable | Type | Subtype | Description |
|---|---|---|---|
Major | Qualitative | Nominal | Categories with no natural order |
Number of courses | Quantitative | Discrete | Values are counted |
ZIP code | Qualitative | Nominal | Labels with no meaningful order |
Hours slept | Quantitative | Continuous | Values are measured |
Class year | Qualitative | Ordinal | Categories with a natural order |
Number of siblings | Quantitative | Discrete | Values are counted |
Height | Quantitative | Continuous | Values are measured |
Course rating | Qualitative | Ordinal | Categories with a natural order |
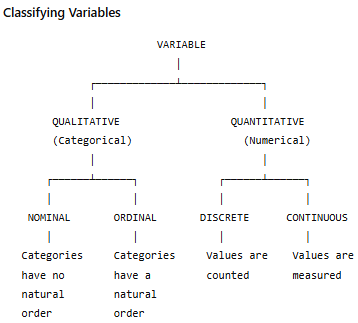
Decision Tree for Classifying Variables
A helpful approach to classifying variables is to follow a logical decision tree:
Does the variable describe a category or measure/count a quantity?
If it describes a category: Qualitative
If it measures/counts a quantity: Quantitative
If qualitative, do categories have a natural order?
No natural order: Nominal
Natural order: Ordinal
If quantitative, are values counted or measured?
Counted: Discrete
Measured: Continuous
Key Definitions and Examples
Population: The entire group of individuals or items of interest.
Sample: A subset of the population used to collect data.
Variable: A characteristic measured for each individual in the population.
Data: The values obtained from measuring variables.
Example: In a survey of college students, variables might include age (quantitative), major (qualitative), and GPA (quantitative).
Formulas and Notation
While this section focuses on classification, introductory statistics often uses the following notation:
Population size:
Sample size:
Variable:
Data value:
For example, if is the number of courses a student is taking, could be 3, 4, or 5 for different students.
Applications and Importance
Classifying variables correctly is essential for choosing appropriate statistical methods and interpreting results. For example, qualitative variables are summarized using frequency tables and bar charts, while quantitative variables are analyzed using measures of central tendency and dispersion.
Application: In business, classifying customer feedback as ordinal (e.g., ratings) helps in analyzing satisfaction trends.
Application: In health studies, distinguishing between discrete (number of doctor visits) and continuous (blood pressure) variables guides the choice of statistical tests.
Additional info: The classification tree image visually reinforces the decision process for classifying variables, directly supporting the explanation in the paragraph above.
