 뒤로
뒤로Introduction to Statistics: Statistical and Critical Thinking, Types of Data, and Collecting Sample Data
스터디 가이드 - 스마트 노트
 자료에 맞춘 맞춤형 노트, 핵심 정의, 예시, 맥락을 확장해 제공합니다.
Introduction to Statistics
Statistical and Critical Thinking
Statistics is the science of planning studies and experiments, obtaining data, and organizing, summarizing, presenting, analyzing, and interpreting those data to draw conclusions. Statistical thinking involves critical thinking and the ability to make sense of results, requiring more than just computational skills.
Statistical Study Process: The process consists of three main steps: prepare, analyze, and conclude.
Critical Thinking: Essential for interpreting results and making informed decisions based on data.

Types of Data
Definitions and Examples
Understanding the types of data is fundamental in statistics. Data are collections of observations, such as measurements, genders, or survey responses.
Data: Collections of observations (e.g., measurements, survey responses).
Population: The complete collection of all measurements or data being considered. It is the group about which we want to make inferences.
Census: Collection of data from every member of a population.
Sample: A subcollection of members selected from a population.
Example: Residential Carbon Monoxide Detectors
In a study, 30 detectors were randomly selected from 38 million installed in the U.S., and 12 failed to provide an alarm in hazardous conditions. Here, the population is all 38 million detectors, and the sample is the 30 tested detectors. The objective is to use sample data to draw conclusions about the population.
Collecting Sample Data
Sampling Methods and Potential Bias
The method of collecting data is crucial for the validity of statistical conclusions. Reliable sources and unbiased sampling methods are essential.
Source of Data: Data should be obtained from reputable sources to ensure reliability.
Sampling Method: Data should be collected in a way that is unbiased. For example, official government records are typically reliable.
Voluntary Response Sample
A voluntary response sample (or self-selected sample) is one in which respondents themselves decide whether to be included. This method is prone to bias and should not be used to make conclusions about a population.
Examples: Internet polls, mail-in polls, telephone call-in polls.
Bias: These samples are seriously flawed due to the strong possibility of bias.
Example: Voluntary Response Sample
Nightline asked viewers to call with their opinion about the UN headquarters. 67% of 186,000 respondents wanted the UN moved, but a separate random survey of 500 people found only 38% wanted the move. The random sample provides more reliable results due to superior sampling methods.
Statistical Study Process: Prepare, Analyze, Conclude
Prepare
Preparation involves understanding the context, source, and sampling method. For example, a table of pleasure boats and manatee fatalities in Florida aims to determine if there is a relationship between the number of boats and manatee deaths.
Context: What do the data represent? What is the goal?
Source: Are the data from a reputable source?
Sampling Method: Was the data collected in an unbiased way?
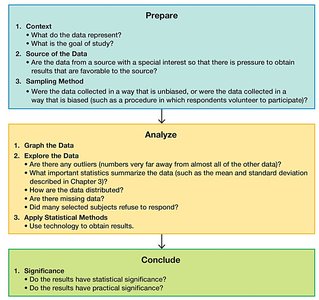
Analyze
Analysis involves applying statistical methods, graphing, and exploring the data. Common sense and attention to sound statistical methods are required.
Graph and Explore: Begin with appropriate graphs and exploration of the data.
Apply Statistical Methods: Use statistical techniques to analyze the data.
Conclude
Conclusions should distinguish between statistical significance and practical significance.
Statistical Significance: Achieved if the likelihood of an event occurring by chance is 5% or less.
Practical Significance: Even if a result is statistically significant, it may not be practically significant if the effect is too small to be meaningful.
Example: Statistical vs Practical Significance
Suppose a product is tested with 10,000 couples wanting girls, and 5,200 girls are born. This result is statistically significant (likelihood due to chance is 0.003%), but the increase from 50% to 52% is not practically significant.
Analyzing Data: Potential Pitfalls
Common Pitfalls in Data Analysis
Several pitfalls can undermine the validity of statistical conclusions.
Misleading Conclusions: Conclusions should be clear and understandable.
Sample Data Reported Instead of Measured: It is better to take measurements yourself rather than rely on self-reported data.
Loaded Questions: Poorly worded survey questions can lead to misleading results.
Order of Questions: The order of survey questions can unintentionally bias responses.
Nonresponse: Occurs when someone refuses to respond or is unavailable.
Percentages: Be cautious of misleading percentages, especially those exceeding 100%.
Tabular Data Example
Pleasure Boats and Manatee Fatalities
The following table compares the number of pleasure boats (in tens of thousands) and manatee fatalities in Florida over several years. The purpose is to determine if there is a relationship between the number of boats and manatee deaths.
Pleasure Boats (tens of thousands) | Manatee Fatalities |
|---|---|
99 | 92 |
99 | 73 |
97 | 90 |
95 | 97 |
90 | 83 |
90 | 88 |
87 | 81 |
90 | 73 |
90 | 68 |

Additional info: The table is used to illustrate the relationship between two variables and the importance of context, source, and sampling method in statistical studies.
